The VISION Project The VISION project conducted a ValIdated Systematic IntegratiON of epigenetic datasets across progenitor and differentiated blood cell types in mouse and human (Heuston et al. 2018, Xiang et al. 2020, Xiang et al. 2024). The project was carried out by an international group of scientists funded by the National Institute of Diabetes, Digestive, and Kidney Diseases of the National Institutes of Health (grant R24DK106766) and with intramural support from the National Human Genome Research Institute. Key products and results of the project can be visualized on the UCSC Genome Browser using this track hub. The project website provides other servers, databases, and data downloads.
Epigenetic signals The integrative and discriminative analysis in the VISION project focused on genome-wide determinations of levels for epigenetic signals across hematopoietic blood cell types. This super track of "Epigenetic signals" provides access and visualization to the normalized epigenetic signals. These normalized signals are available as normalized counts of mapped reads in the composite track "Signal normalized counts" and as p-values for deviation from expectation of a negative binomial distribution in the composite track "Signal p-values".
The normalized epigenetic signals were the input for discovering and annotating epigenetic states using the IDEAS method, as described on the Track Settings page for the super track "Epigenetic states".
For each blood cell type, selected data on chromatin accessibility (ATAC-seq), CTCF occupancy, and histone modifications (specifically H3K27ac, H3K27me3, H3K36me3, H3K4me1, H3K4me3, and H3K9me3) were downloaded or determined, normalized, and used as input to IDEAS segmentation and genome annotation (Xiang et al. 2024).
In "dense" mode, the display gives a compact view of the level of epigenetic signal for each feature in each cell type. In "full" mode, the normalized signal strength is shown as a continuous, variable signal. Users have options for setting the y-axis on the Track Settings page of each composite track.
The track names (short name and the end of the long name) give an abbreviation for the blood cell type and the biosamples from the Blueprint Consortium (replicates are from different donors) or the file id after downloading and processing other published data (100xxx). The cell types are HSC = hematopoietic stem cell, MPP = multipotent progenitor cell, LMPP = lymphoid-myeloid primed progenitor cell, CMP = common myeloid progenitor, MEP = megakaryocyte erythrocyte progenitor, GMP = granulocyte monocyte progenitor, CLP = common lymphoid progenitor, CD34_E = erythroblasts generated by in vitro differentiation of CD34+ HSCs, ERY = erythroblast, MK = megakaryocyte, EOS = eosinophil, MONp = primary monocyte, MONc = classical monocyte, NEU = neutrophil, B = B cell, NK = natural killer cell, T_CD4 = CD4+ T cell, T_CD8 = CD8+ T cell, HUDEP = immortalized human umbilical cord blood—derived erythroid progenitor cell lines expressing fetal globin genes (HUDEP1) or adult globin genes (HUDEP2), K562 = a human cancer cell line with some features of early megakaryocytic and erythroid cells. AVE is a track with state assignments based on the average signal for each epigenetic feature across cell types.
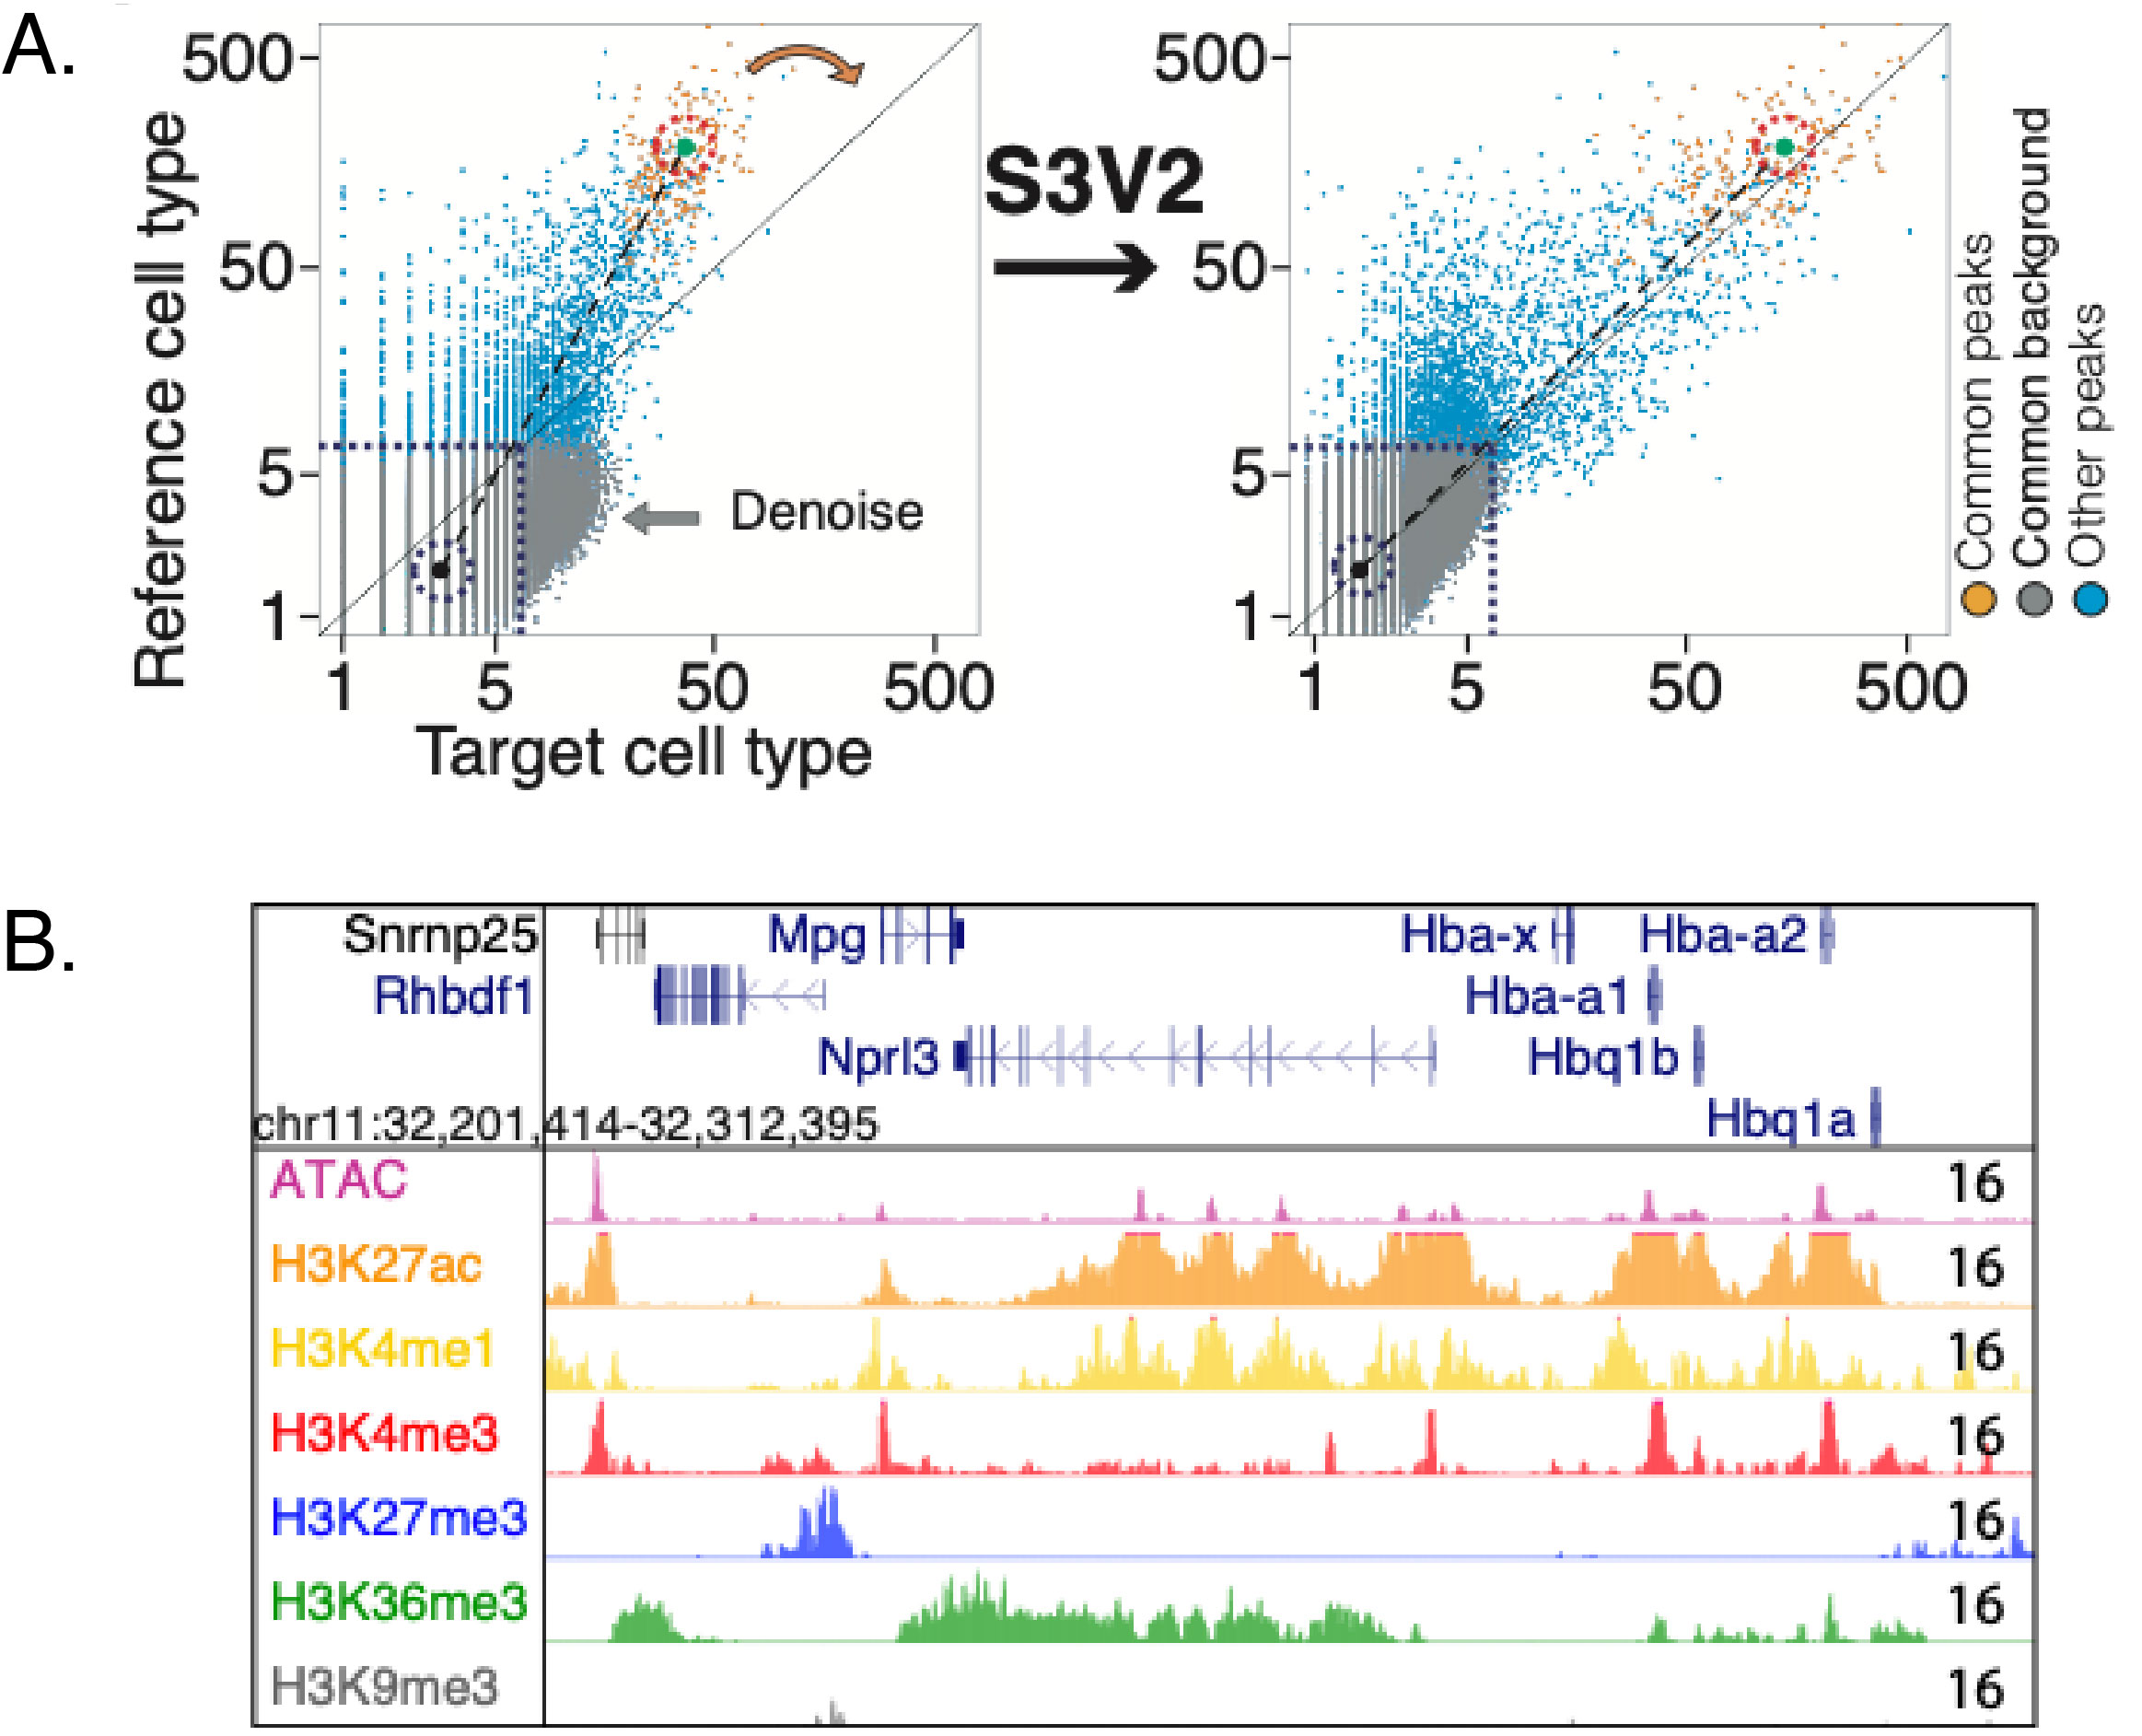
The genome-wide signals for the epigenetic features were normalized across cell types using the S3V2 version of S3norm in the pipeline S3V2-IDEAS (Xiang et al. 2020 and 2021). The S3V2 method was developed to normalize the signal to bring out peaks without inflating the background while also denoising the data, as illustrated in the Figure.
Much of the input data were downloaded from the data portal of the BLUEPRINT Project (Adams et al. 2012); all data sources are provided in Xiang et al. 2024.
The data normalization was done by Guanjue Xiang. The data downloads, re-mapping and processing, generation of the tracks displayed, and development of the track hub were done by Belinda Giardine.
Adams D, Altucci L, Antonarakis SE, Ballesteros J, Beck S, Bird A, Bock C, Boehm B, Campo E, Caricasole A, Dahl F, Dermitzakis ET, Enver T, Esteller M, Estivill X, Ferguson-Smith A, Fitzgibbon J, Flicek P, Giehl C, Graf T, Grosveld F, Guigo R, Gut I, Helin K, Jarvius J, Küppers R, Lehrach H, Lengauer T, LernmarkA, Leslie D, Loeffler M, Macintyre E, Mai A, Martens JH, Minucci S, Ouwehand WH, Pelicci PG, Pendeville H, Porse B, Rakyan V, Reik W, Schrappe M, Schübeler D, Seifert M, Siebert R, Simmons D, Soranzo N, Spicuglia S, Stratton M, Stunnenberg HG, Tanay A, Torrents D, Valencia A, Vellenga E, Vingron M, Walter J, Willcocks S. BLUEPRINT to decode the epigenetic signature written in blood. Nat Biotechnol. 2012 Mar 7;30(3):224-6. doi: 10.1038/nbt.2153. PMID: 22398613.
Heuston EF, Keller CA, Lichtenberg J, Giardine B, Anderson SM; NIH Intramural Sequencing Center; Hardison RC, Bodine DM. Establishment of regulatory elements during erythro-megakaryopoiesis identifies hematopoietic lineage-commitment points. Epigenetics Chromatin. 2018 May 28;11(1):22. PMID: 29807547; PMCID: PMC5971425.
Xiang G, Keller CA, Heuston E, Giardine BM, An L, Wixom AQ, Miller A, Cockburn A, Sauria MEG, Weaver K, Lichtenberg J, Göttgens B, Li Q, Bodine D, Mahony S, Taylor J, Blobel GA, Weiss MJ, Cheng Y, Yue F, Hughes J, Higgs DR, Zhang Y, Hardison RC. An integrative view of the regulatory and transcriptional landscapes in mouse hematopoiesis. Genome Res. 2020 Mar;30(3):472-484. PMID: 32132109; PMCID: PMC7111515.
Xiang G, Keller CA, Giardine B, An L, Li Q, Zhang Y, Hardison RC. S3norm: simultaneous normalization of sequencing depth and signal-to-noise ratio in epigenomic data. Nucleic Acids Res. 2020 May 7;48(8):e43. doi:10.1093/nar/gkaa105. PMID: 32086521; PMCID: PMC7192629.
Xiang G, Giardine BM, Mahony S, Zhang Y, Hardison RC. S3V2-IDEAS: a package for normalizing, denoising and integrating epigenomic datasets across different cell types. Bioinformatics. 2021 Sep 29;37(18):3011-3013. doi:10.1093/bioinformatics/btab148. PMID: 33681991; PMCID: PMC8479670.
Xiang G, He X, Giardine BM, Isaac KJ, Taylor DJ, McCoy RC, Jansen C, Keller CA, Wixom AQ, Cockburn A, Miller A, Qi Q, He Y, Li Y, Lichtenberg J, Heuston EF, Anderson SM, Luan J, Vermunt MW, Yue F, Sauria MEG, Schatz MC, Taylor J, Göttgens B, Hughes JR, Higgs DR, Weiss MJ, Cheng Y, Blobel GA, Bodine DM, Zhang Y, Li Q, Mahony S, Hardison RC. Interspecies regulatory landscapes and elements revealed by novel joint systematic integration of human and mouse blood cell epigenomes. Genome Res. 2024 Aug 20;34(7):1089-1105. PMID: 38951027; PMCID: PMC11368181.
These data are available for use without restrictions.
Ross Hardison rch8@psu.edu