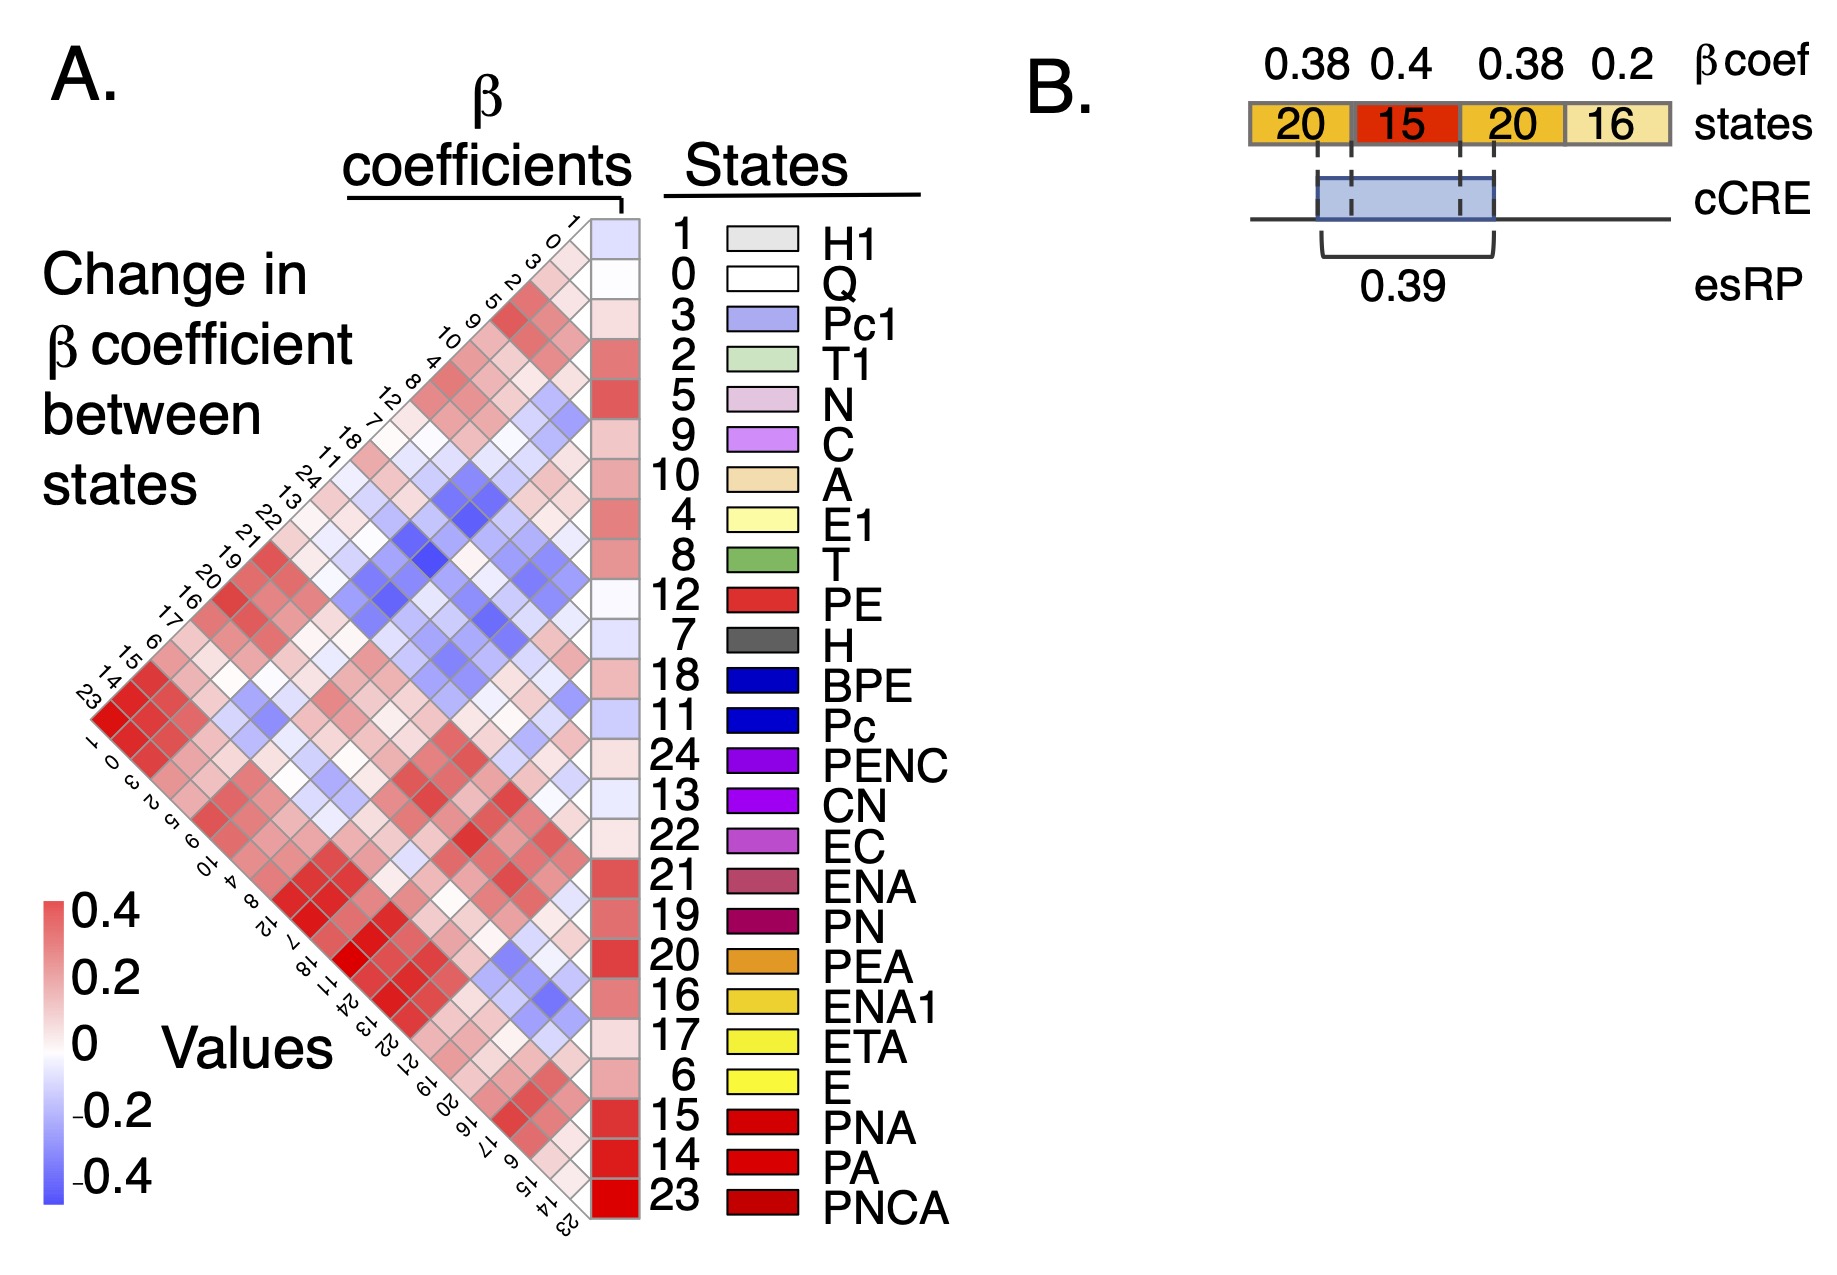
Beta coefficient scores The beta coefficients are estimates of the contribution of an epigenetic state to the level of expression of target genes; they were determined from a multivariate regression of epigenetic states in cCREs across cell types against the level of target gene expression across cell types (Xiang et al. 2020 and 2024). The epigenetic states were determined using the IDEAS genome segmentation and annotation system; they are displayed on the companion track IDEAS human-mouse, which is in the super track Epigenetic states. Each of the 25 epigenetic states has a beta coefficient score, and the states and scores were assigned in 200 bp windows for the epigenomes of each cell type. These scores are genome-wide except in blacklisted regions.
In "dense" mode, the display shows a gray-scale visualization of the beta coefficient for each 200bp window in each cell type. In "full" mode, the values of the beta coefficients are plotted as a continuous variable along the chromosomes for each cell type. Useful settings for the data range (y-axis) are from -0.1 to 0.5.
The track names (short name and the end of the long name) give an abbreviation for the blood cell type and the biosamples from the Blueprint Consortium (replicates are from different donors) or the file id after downloading and processing other published data (100xxx). The cell types are HSC = hematopoietic stem cell, MPP = multipotent progenitor cell, LMPP = lymphoid-myeloid primed progenitor cell, CMP = common myeloid progenitor, MEP = megakaryocyte erythrocyte progenitor, GMP = granulocyte monocyte progenitor, CLP = common lymphoid progenitor, CD34_E = erythroblasts generated by in vitro differentiation of CD34+ HSCs, ERY = erythroblast, MK = megakaryocyte, EOS = eosinophil, MONp = primary monocyte, MONc = classical monocyte, NEU = neutrophil, B = B cell, NK = natural killer cell, T_CD4 = CD4+ T cell, T_CD8 = CD8+ T cell, HUDEP = immortalized human umbilical cord blood—derived erythroid progenitor cell lines expressing fetal globin genes (HUDEP1) or adult globin genes (HUDEP2), K562 = a human cancer cell line with some features of early megakaryocytic and erythroid cells. AVE is a track with state assignments based on the average signal for each epigenetic feature across cell types.
The multivariate regression and beta coefficients are described in Xiang et al. (2024) and on the Track Settings page for the parent super track Epigenetic state Regulatory Potential.
The multivariate regression and determination of beta coefficients were done by Guanjue Xiang. Belinda Giardine calculated the beta coefficients genome-wide, generated the tracks displayed, and developed the track hub.
Heuston EF, Keller CA, Lichtenberg J, Giardine B, Anderson SM; NIH Intramural Sequencing Center; Hardison RC, Bodine DM. Establishment of regulatory elements during erythro-megakaryopoiesis identifies hematopoietic lineage-commitment points. Epigenetics Chromatin. 2018 May 28;11(1):22. PMID: 29807547; PMCID: PMC5971425.
Xiang G, Keller CA, Heuston E, Giardine BM, An L, Wixom AQ, Miller A, Cockburn A, Sauria MEG, Weaver K, Lichtenberg J, Göttgens B, Li Q, Bodine D, Mahony S, Taylor J, Blobel GA, Weiss MJ, Cheng Y, Yue F, Hughes J, Higgs DR, Zhang Y, Hardison RC. An integrative view of the regulatory and transcriptional landscapes in mouse hematopoiesis. Genome Res. 2020 Mar;30(3):472-484. PMID: 32132109; PMCID: PMC7111515.
Xiang G, He X, Giardine BM, Isaac KJ, Taylor DJ, McCoy RC, Jansen C, Keller CA, Wixom AQ, Cockburn A, Miller A, Qi Q, He Y, Li Y, Lichtenberg J, Heuston EF, Anderson SM, Luan J, Vermunt MW, Yue F, Sauria MEG, Schatz MC, Taylor J, Göttgens B, Hughes JR, Higgs DR, Weiss MJ, Cheng Y, Blobel GA, Bodine DM, Zhang Y, Li Q, Mahony S, Hardison RC. Interspecies regulatory landscapes and elements revealed by novel joint systematic integration of human and mouse blood cell epigenomes. Genome Res. 2024 Aug 20;34(7):1089-1105. PMID: 38951027; PMCID: PMC11368181.
These data are available for use without restrictions.
Ross Hardison rch8@psu.edu