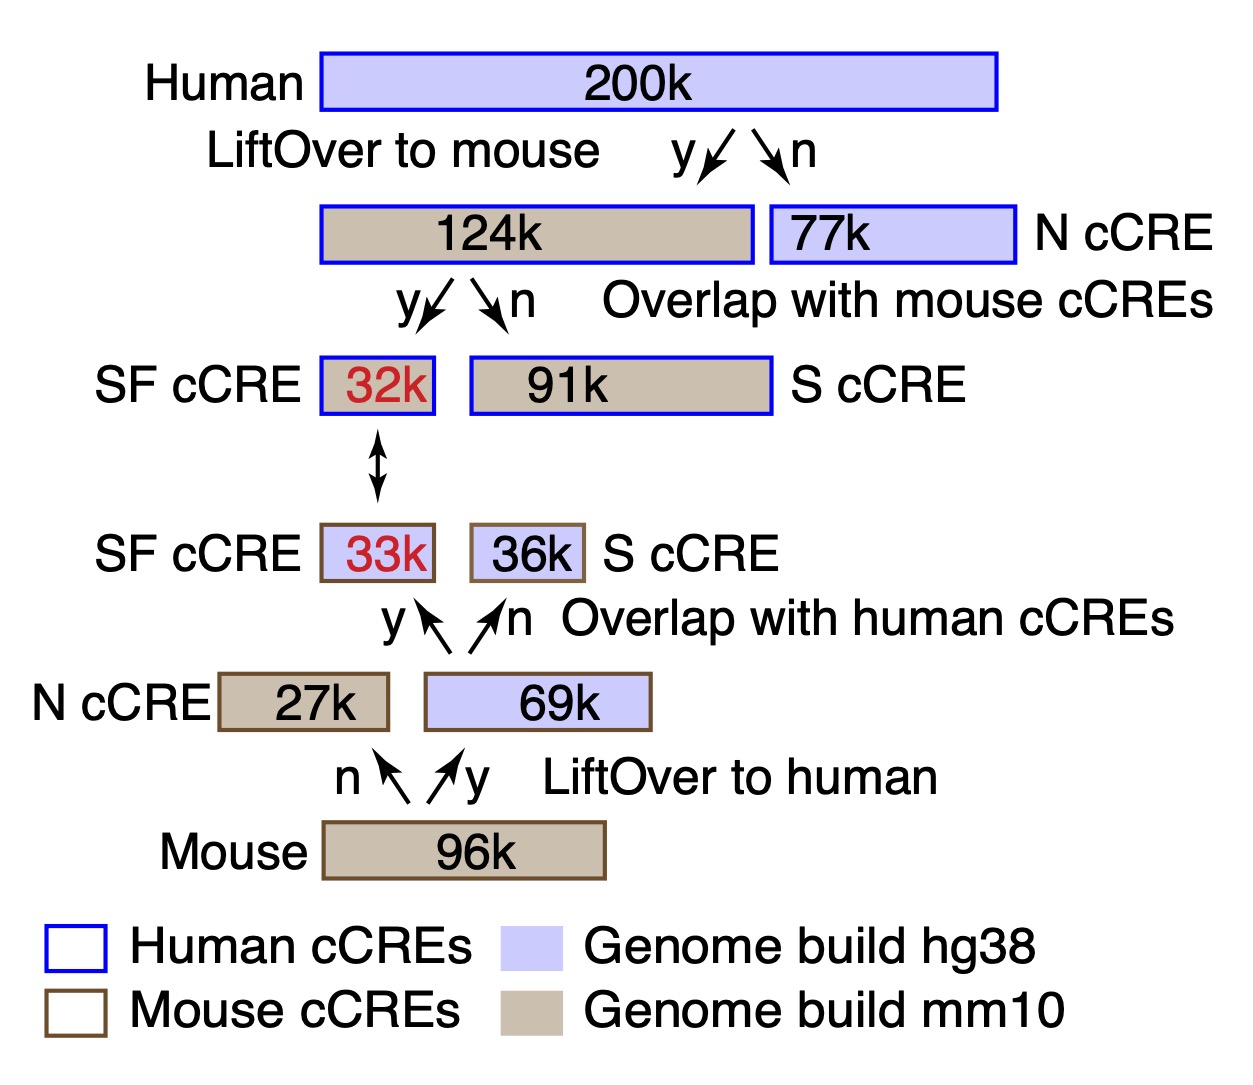
Candidate cis-regulatory elements, or cCREs The set of cCREs displayed in this track consists of a union and merge of the cCREs called in all the cell types used in the joint human-mouse IDEAS segmentation (Xiang et al. 2024). Each cCRE is colored by the evolutionary and epigenetic categories illustrated in Figure 1 below.
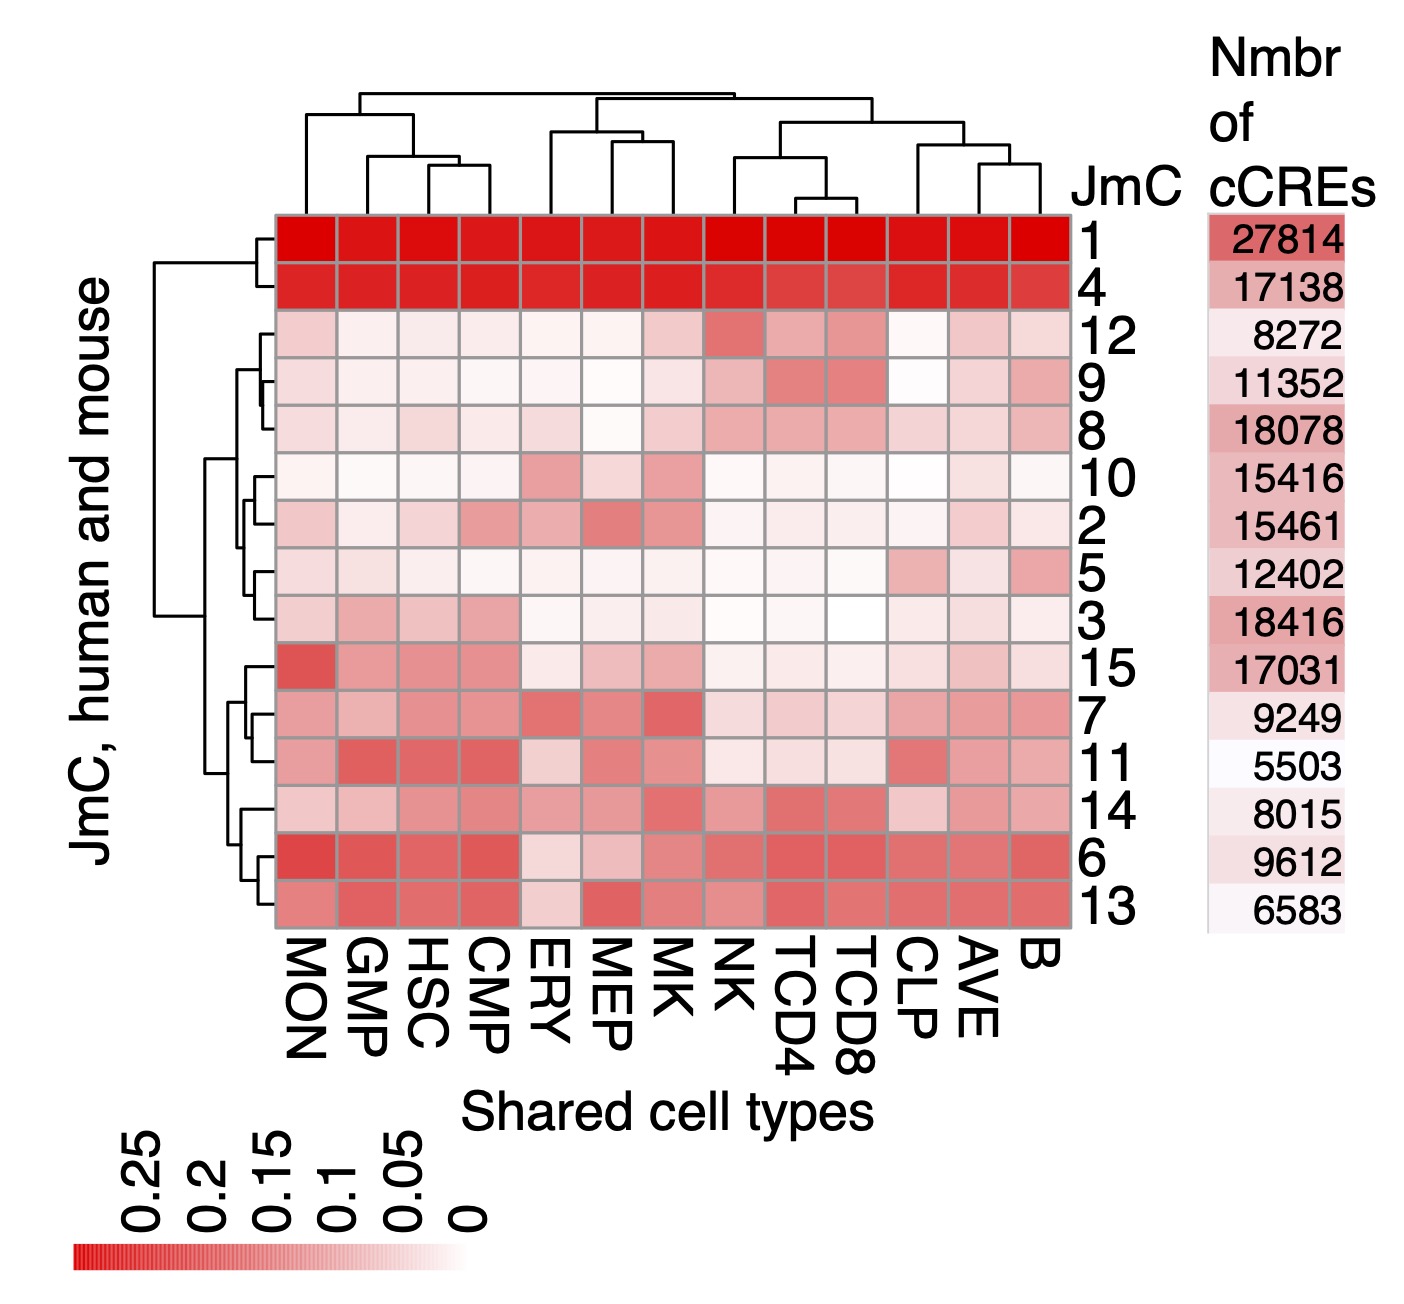
Each cCRE also has a label that gives the evolutionary category followed by the joint metacluster (JmC) to which it is assigned (Xiang et al. 2024). Each JmC groups cCREs with similar activity profiles across blood cell types in both human and mouse (Figure 2). The VISION resources employed in developing the JmCs are available in the sister super track Epigenetic state Regulatory Potential in this track hub.
In "dense" mode, the display shows the position of each cCRE, which is colored based on the evolutionary category (considering both DNA sequence conservation and conservation of inferred function) to which it is assigned. The color codes are defined in the Description section. In "pack" or "full" mode, the genomic intervals are labeled with the evolutionary category (Figure 1) and the joint metacluster to which it is assigned (Figure 2).
The use of IDEAS in the IS mode for peak calling on chromatin accessibility data was described in Xiang et al. 2021 and Xiang et al. 2024. The assignments of cCREs to evolutionary categories and the joint metaclusters were described in Xiang et al. 2024.
The data normalization and peak calls using IDEAS in the IS mode and generation of the joint metaclusters were done by Guanjue Xiang. Xi He assigned cCREs to the evolutionary categories. The data downloads, re-mapping and processing, generation of the tracks displayed, and development of the track hub were done by Belinda Giardine.
Xiang G, Keller CA, Heuston E, Giardine BM, An L, Wixom AQ, Miller A, Cockburn A, Sauria MEG, Weaver K, Lichtenberg J, Göttgens B, Li Q, Bodine D, Mahony S, Taylor J, Blobel GA, Weiss MJ, Cheng Y, Yue F, Hughes J, Higgs DR, Zhang Y, Hardison RC. An integrative view of the regulatory and transcriptional landscapes in mouse hematopoiesis. Genome Res. 2020 Mar;30(3):472-484. PMID: 32132109; PMCID: PMC7111515.
Xiang G, Keller CA, Giardine B, An L, Li Q, Zhang Y, Hardison RC. S3norm: simultaneous normalization of sequencing depth and signal-to-noise ratio in epigenomic data. Nucleic Acids Res. 2020 May 7;48(8):e43. doi:10.1093/nar/gkaa105. PMID: 32086521; PMCID: PMC7192629.
Xiang G, Giardine BM, Mahony S, Zhang Y, Hardison RC. S3V2-IDEAS: a package for normalizing, denoising and integrating epigenomic datasets across different cell types. Bioinformatics. 2021 Sep 29;37(18):3011-3013. doi:10.1093/bioinformatics/btab148. PMID: 33681991; PMCID: PMC8479670.
Xiang G, He X, Giardine BM, Isaac KJ, Taylor DJ, McCoy RC, Jansen C, Keller CA, Wixom AQ, Cockburn A, Miller A, Qi Q, He Y, Li Y, Lichtenberg J, Heuston EF, Anderson SM, Luan J, Vermunt MW, Yue F, Sauria MEG, Schatz MC, Taylor J, Göttgens B, Hughes JR, Higgs DR, Weiss MJ, Cheng Y, Blobel GA, Bodine DM, Zhang Y, Li Q, Mahony S, Hardison RC. Interspecies regulatory landscapes and elements revealed by novel joint systematic integration of human and mouse blood cell epigenomes. Genome Res. 2024 Aug 20;34(7):1089-1105. PMID: 38951027; PMCID: PMC11368181.
These data are available for use without restrictions.
Ross Hardison rch8@psu.edu