Epigenetic states from IDEAS human-mouse joint segmentation The general approach of the IDEAS segmentation and genomic annotation system, along with the epigenetic signal inputs, are described on the Track Settings page of the parent super track (Epigenetic states). This composite track displays the result of jointly modeling epigenetic states in human and mouse blood cells. The states were learned in an iterative process that included input of states learned in one species into the modeling of states in the other species, leading to a 25 state model with the same states in each species (Xiang et al. 2024).
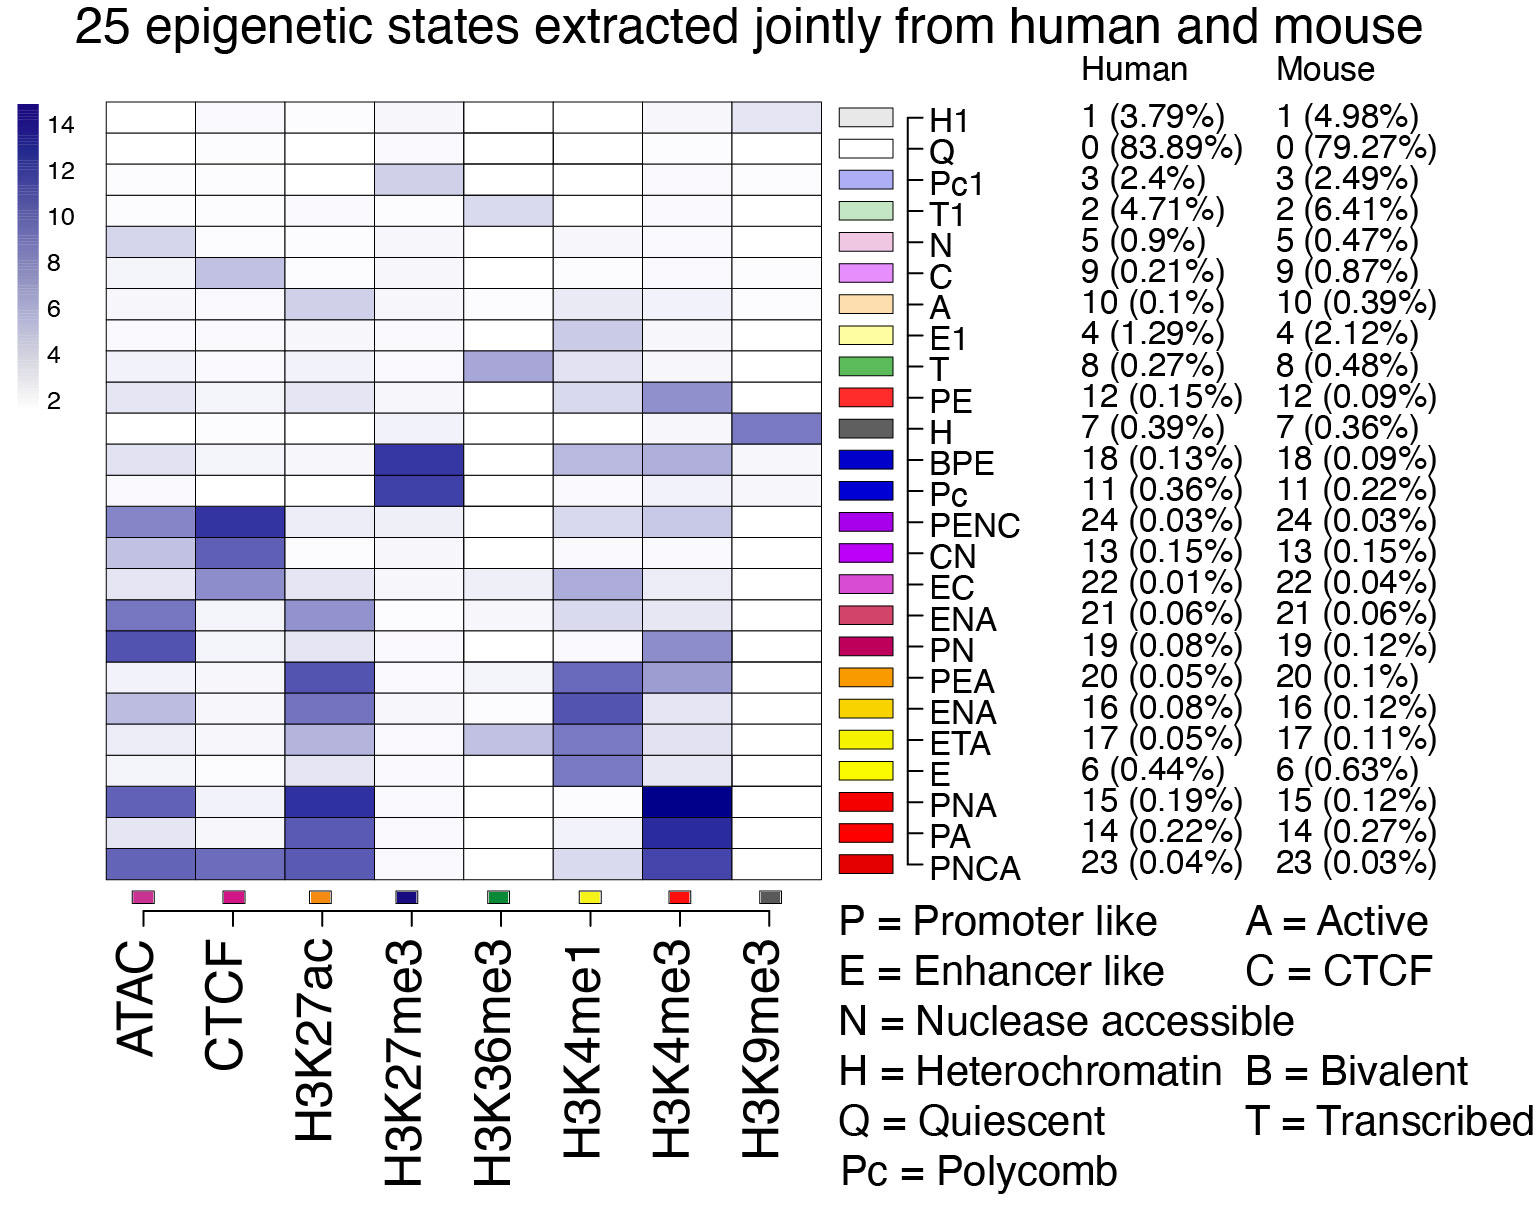
The composition of the 25 states learned in the joint modeling is shown in the Figure below. The shade of blue in each cell illustrates the contribution of each of the input signals to the state, which is basically the emission frequency computed for that state. The normalized epigenetic signals used as input were chromatin accessibility from ATAC-seq, CTCF occupancy, and levels of the histone modifications H3K27ac, H3K27me3, H3K36me3, H3K4me1, H3K4me3, and H3K9me3 in multiple blood cell types.
The tracks show state annotations across the genomes in each of the several blood cell types.
In "dense" mode, the display gives a compact view of the epigenetic landscape in each cell type. In "pack" or "full" mode, the genomic intervals are annotated with the number of the chromatin state (see right side of the Figure) in each cell type, which can distinguish between states with similar colors.
The track names (short name and the end of the long name) give an abbreviation for the blood cell type and the biosamples from the Blueprint Consortium (replicates are from different donors) or the file id after downloading and processing other published data (100xxx). The cell types are HSC = hematopoietic stem cell, MPP = multipotent progenitor cell, LMPP = lymphoid-myeloid primed progenitor cell, CMP = common myeloid progenitor, MEP = megakaryocyte erythrocyte progenitor, GMP = granulocyte monocyte progenitor, CLP = common lymphoid progenitor, CD34_E = erythroblasts generated by in vitro differentiation of CD34+ HSCs, ERY = erythroblast, MK = megakaryocyte, EOS = eosinophil, MONp = primary monocyte, MONc = classical monocyte, NEU = neutrophil, B = B cell, NK = natural killer cell, T_CD4 = CD4+ T cell, T_CD8 = CD8+ T cell, HUDEP = immortalized human umbilical cord blood-derived erythroid progenitor cell lines expressing fetal globin genes (HUDEP1) or adult globin genes (HUDEP2), K562 = a human cancer cell line with some features of early megakaryocytic and erythroid cells. AVE is a track with state assignments based on the average signal for each epigenetic feature across cell types.
Xiang G, He X, Giardine BM, Isaac KJ, Taylor DJ, McCoy RC, Jansen C, Keller CA, Wixom AQ, Cockburn A, Miller A, Qi Q, He Y, Li Y, Lichtenberg J, Heuston EF, Anderson SM, Luan J, Vermunt MW, Yue F, Sauria MEG, Schatz MC, Taylor J, Göttgens B, Hughes JR, Higgs DR, Weiss MJ, Cheng Y, Blobel GA, Bodine DM, Zhang Y, Li Q, Mahony S, Hardison RC. Interspecies regulatory landscapes and elements revealed by novel joint systematic integration of human and mouse blood cell epigenomes. Genome Res. 2024 Aug 20;34(7):1089-1105. PMID: 38951027; PMCID: PMC11368181.
These data are available for use without restrictions.
Ross Hardison rch8@psu.edu