The VISION Project The VISION project conducted a ValIdated Systematic IntegratiON of epigenetic datasets across progenitor and differentiated blood cell types in mouse and human (Heuston et al. 2018, Xiang et al. 2020, Xiang et al. 2024). The project was carried out by an international group of scientists funded by the National Institute of Diabetes, Digestive, and Kidney Diseases of the National Institutes of Health (grant R24DK106766) and with intramural support from the National Human Genome Research Institute. Key products and results of the project can be visualized on the UCSC Genome Browser using this track hub. The project website provides other servers, databases, and data downloads.
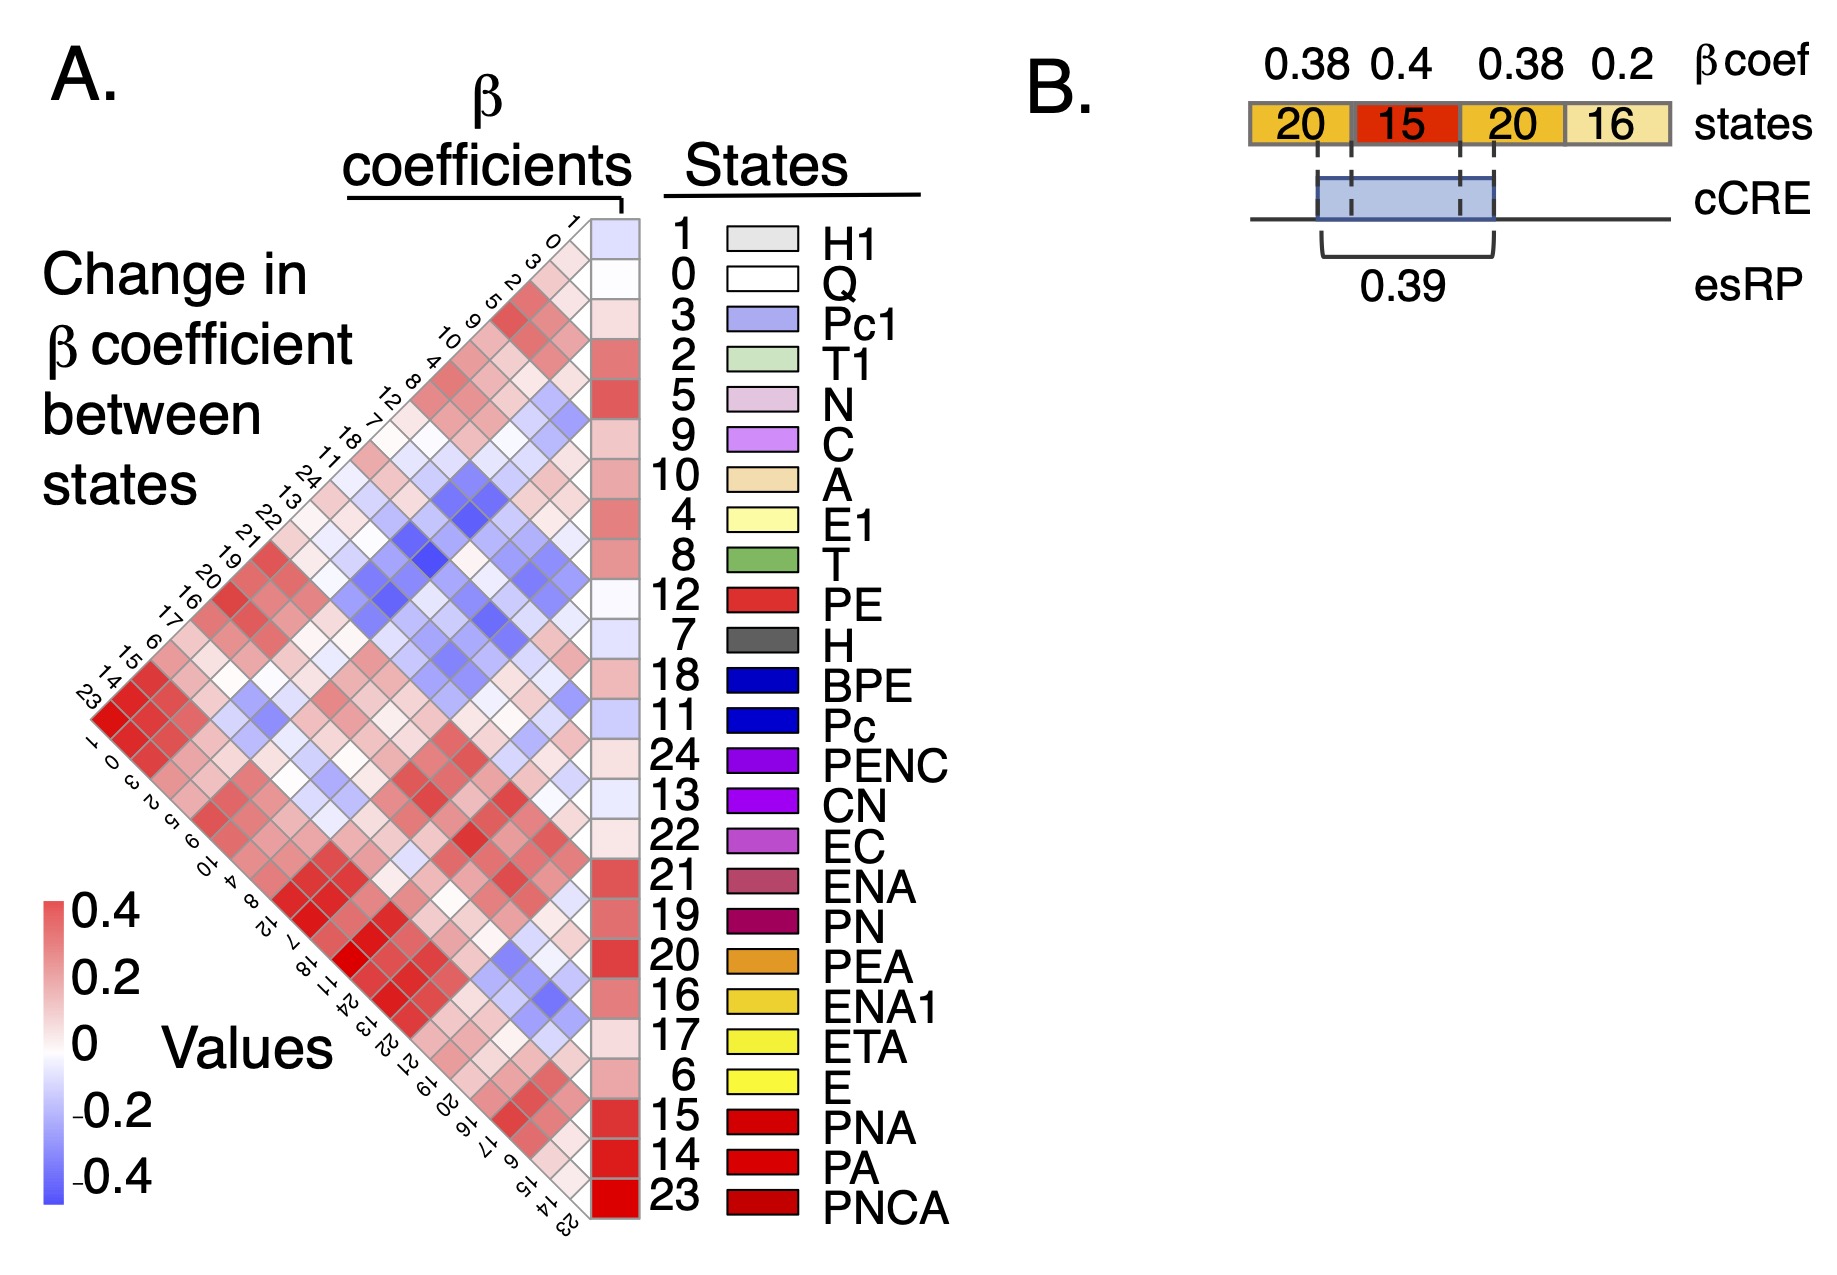
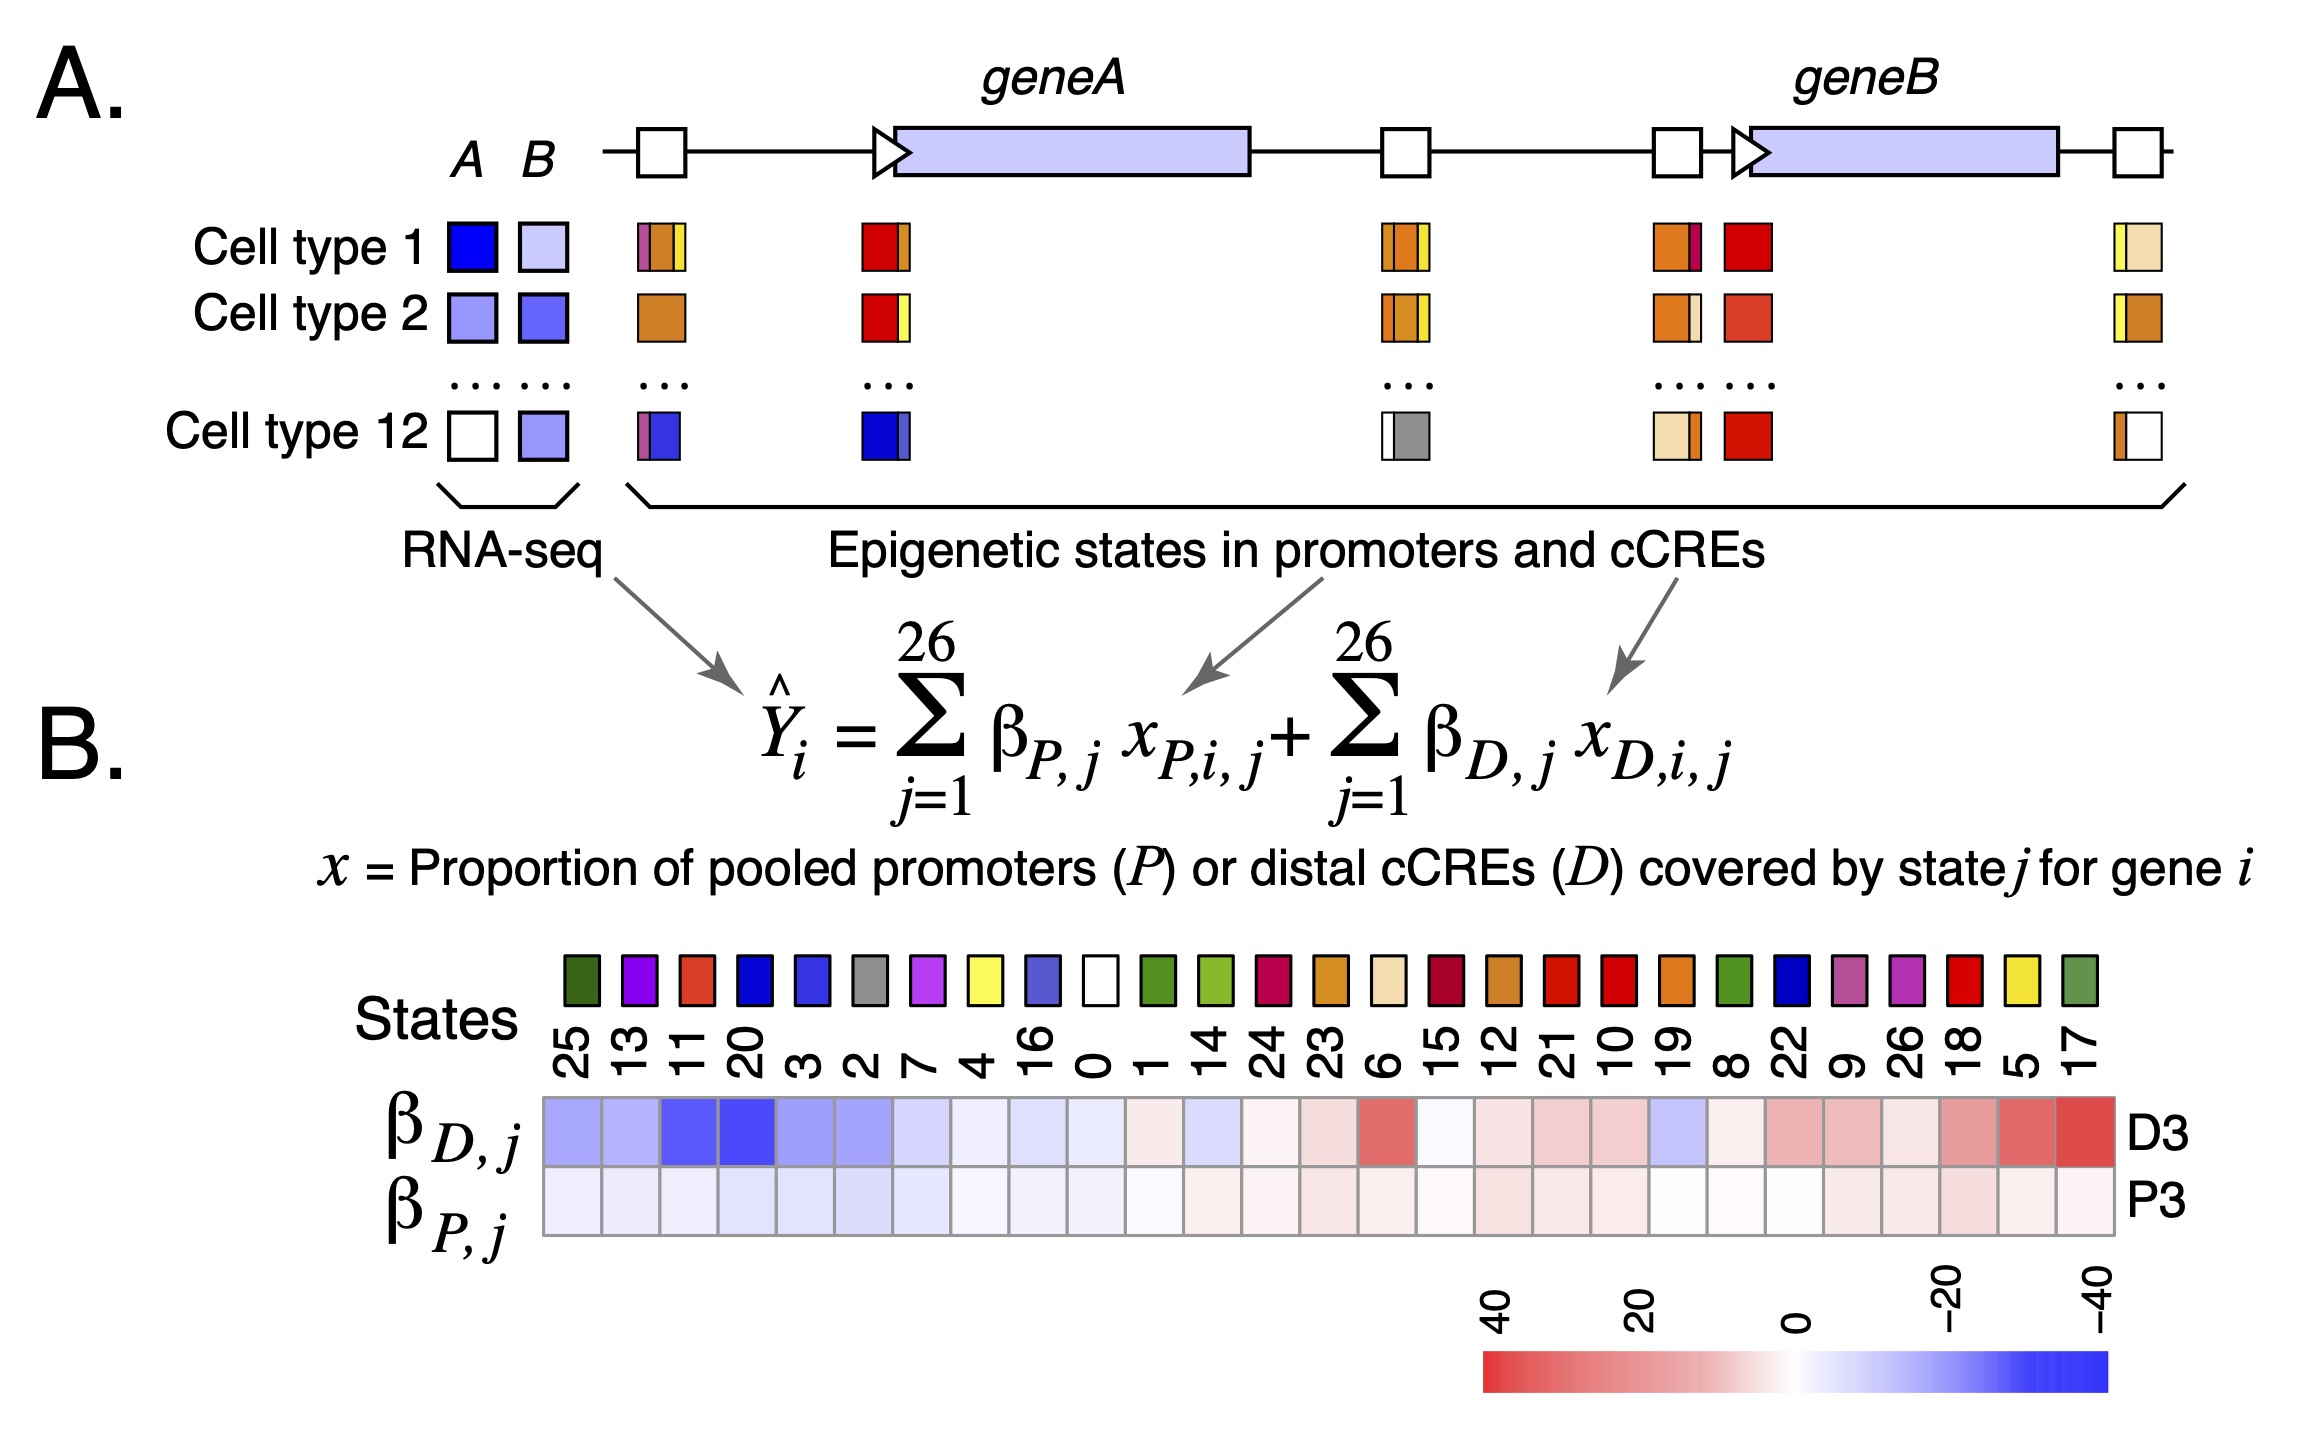
esRP scores for cCREs The epigenetic state Regulatory Potential (esRP) score is an estimate of the contribution of a candidate cis-regulatory element, or cCRE, to the level of expression of a (potential) target gene. The score is derived from the beta coefficients that relate the proportion of cCRE intervals in a particular multi-feature epigenetic state (available in the super track Epigenetic states) to expression levels of target genes in a multivariate linear regression (Xiang et al. 2024; Figure 1A and Figure 2). The esRP score is simply a weighted sum of beta coefficients of states that cover a cCRE in a cell type, where the weights are the region covered by different states (Figure 1B). The cCREs were defined as DNA intervals with a high signal for chromatin accessibility in any cell type (Xiang et al. 2020 and 2024). They can be visualized in the companion super track Candidate CREs, and they are described more thoroughly on the Track Settings page of that super track.
This super track consists of two composite tracks:
These conventions are explained on the Track Settings pages for the two composite tracks.
Estimation of the impact of epigenetic states and cCREs on gene expression In order to use the categorical state assignments to estimate the impact of each cCRE in each cell type on gene expression, we applied a modified version of the iterative multivariate linear regression model developed by Xiang et al. (2020) (Figure 2) to quantify the biological functions of each epigenetic state in terms of regulating gene expression. In this model, we introduced two measurements: β coefficients for each epigenetic state and an esRP (epigenetic state Regulatory Potential) score for each cCRE in each cell type or sample. The biological interpretation of the two measurements are as follows. The beta coefficients measure the contribution of each epigenetic state to the expression of local genes; they are calculated in a multivariate regression evaluating how changes in the coverage of cCREs and promoters by each epigenetic state across cell types impact expression levels. The esRP score measures the contribution of individual cCREs on regulating its target gene's expression level; it is calculated from the overall epigenetic state coverage of the cCRE in each cell type (Figure 1B). In contrast to our previous modeling (Xiang et al. 2020), our current model does not aim to identify the likely target gene(s) for each cCRE. In brief, for the current regression model, the epigenetic state coverage was computed on all cCREs and promoter regions within 50 kb on both sides of the TSS of each gene (an interval of 100kb). We first calculated the beta coefficients of the promoter intervals and distal cCREs as separate terms in the regression model. For further analyses and visualization, including computation of the esRP scores, the beta coefficients of each state were merged into a single value that was the average of the beta coefficients for promoters and for distal cCREs. A more detailed presentation on the calculations of the β coefficients and the esRPs is in the Supplemental Information of Xiang et al. 2024.
Guanjue Xiang calculated the beta-coefficients and esRP scores. Belinda Giardine generated the track displayed and developed the track hub.
Heuston EF, Keller CA, Lichtenberg J, Giardine B, Anderson SM; NIH Intramural Sequencing Center; Hardison RC, Bodine DM. Establishment of regulatory elements during erythro-megakaryopoiesis identifies hematopoietic lineage-commitment points. Epigenetics Chromatin. 2018 May 28;11(1):22. PMID: 29807547; PMCID: PMC5971425.
Xiang G, Keller CA, Heuston E, Giardine BM, An L, Wixom AQ, Miller A, Cockburn A, Sauria MEG, Weaver K, Lichtenberg J, Göttgens B, Li Q, Bodine D, Mahony S, Taylor J, Blobel GA, Weiss MJ, Cheng Y, Yue F, Hughes J, Higgs DR, Zhang Y, Hardison RC. An integrative view of the regulatory and transcriptional landscapes in mouse hematopoiesis. Genome Res. 2020 Mar;30(3):472-484. PMID: 32132109; PMCID: PMC7111515.
Xiang G, He X, Giardine BM, Isaac KJ, Taylor DJ, McCoy RC, Jansen C, Keller CA, Wixom AQ, Cockburn A, Miller A, Qi Q, He Y, Li Y, Lichtenberg J, Heuston EF, Anderson SM, Luan J, Vermunt MW, Yue F, Sauria MEG, Schatz MC, Taylor J, Göttgens B, Hughes JR, Higgs DR, Weiss MJ, Cheng Y, Blobel GA, Bodine DM, Zhang Y, Li Q, Mahony S, Hardison RC. Interspecies regulatory landscapes and elements revealed by novel joint systematic integration of human and mouse blood cell epigenomes. Genome Res. 2024 Aug 20;34(7):1089-1105. PMID: 38951027; PMCID: PMC11368181.
These data are available for use without restrictions.
Ross Hardison rch8@psu.edu