The VISION Project The VISION project conducted a ValIdated Systematic IntegratiON of epigenetic datasets across progenitor and differentiated blood cell types in mouse and human (Heuston et al. 2018, Xiang et al. 2020, Xiang et al. 2024). The project was carried out by an international group of scientists funded by the National Institute of Diabetes, Digestive, and Kidney Diseases of the National Institutes of Health (grant R24DK106766) and with intramural support from the National Human Genome Research Institute. Key products and results of the project can be visualized on the UCSC Genome Browser using this track hub. The project website provides other servers, databases, and data downloads.
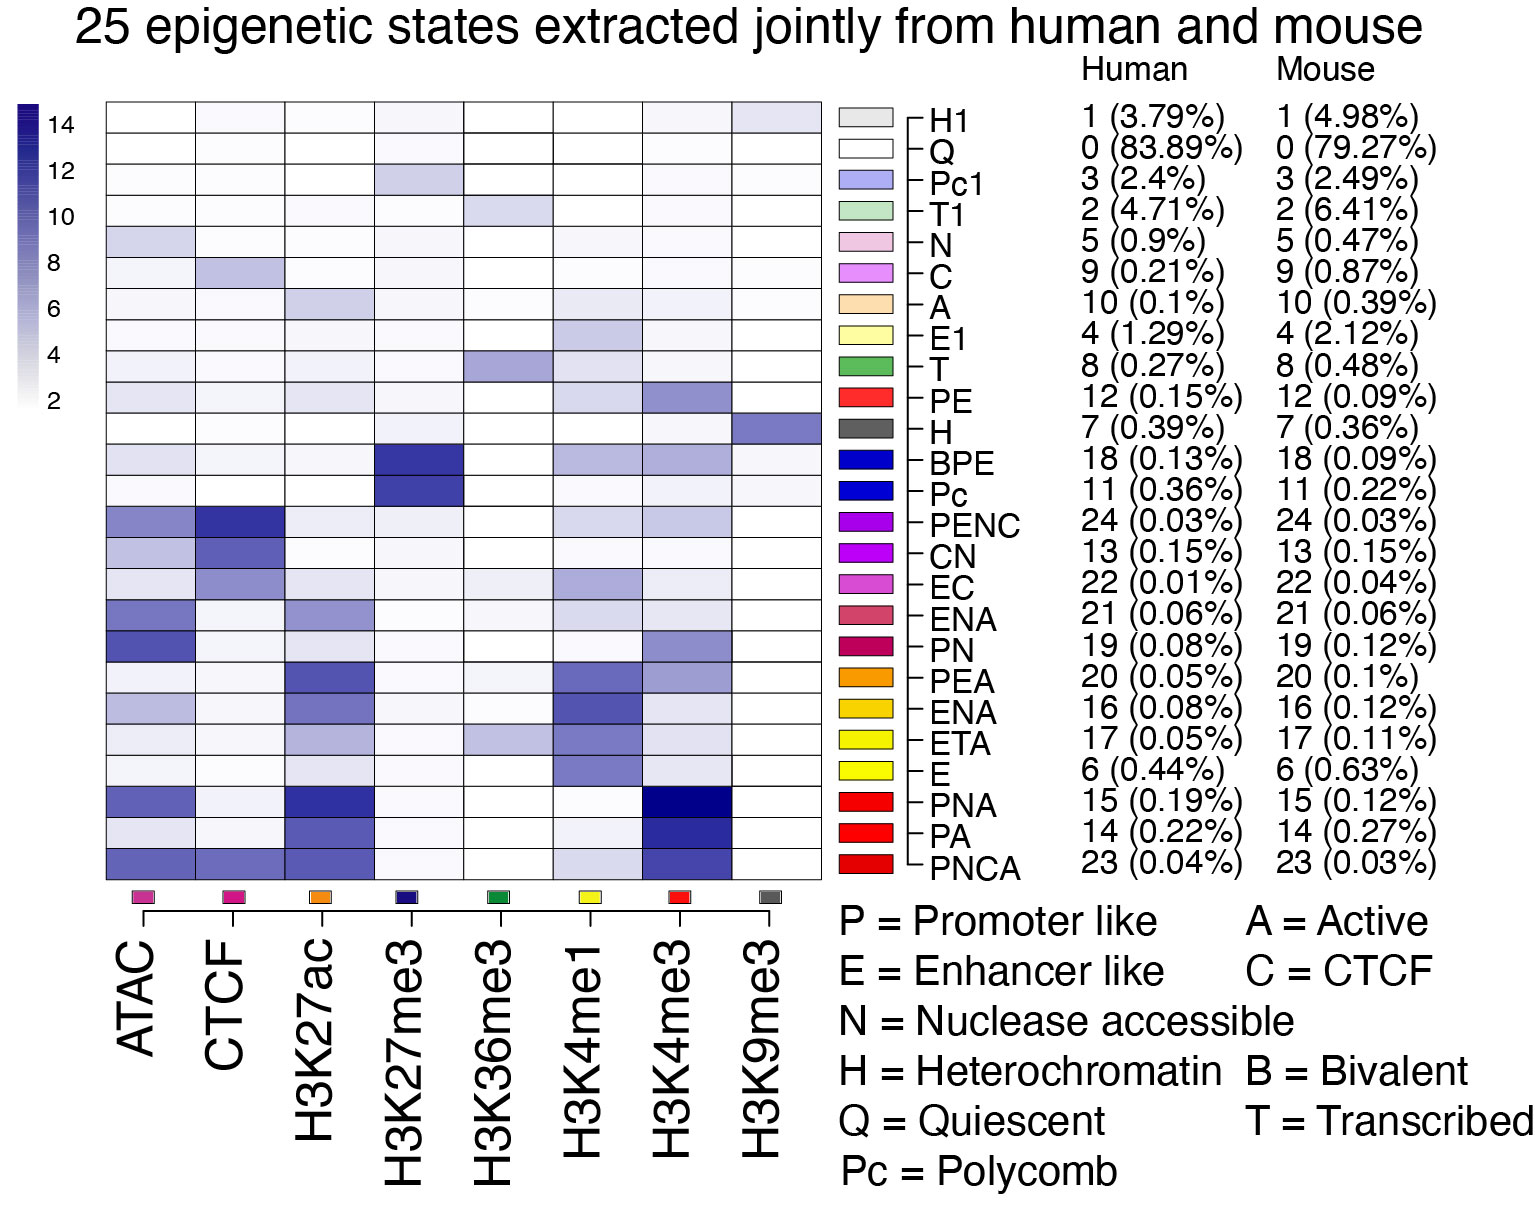
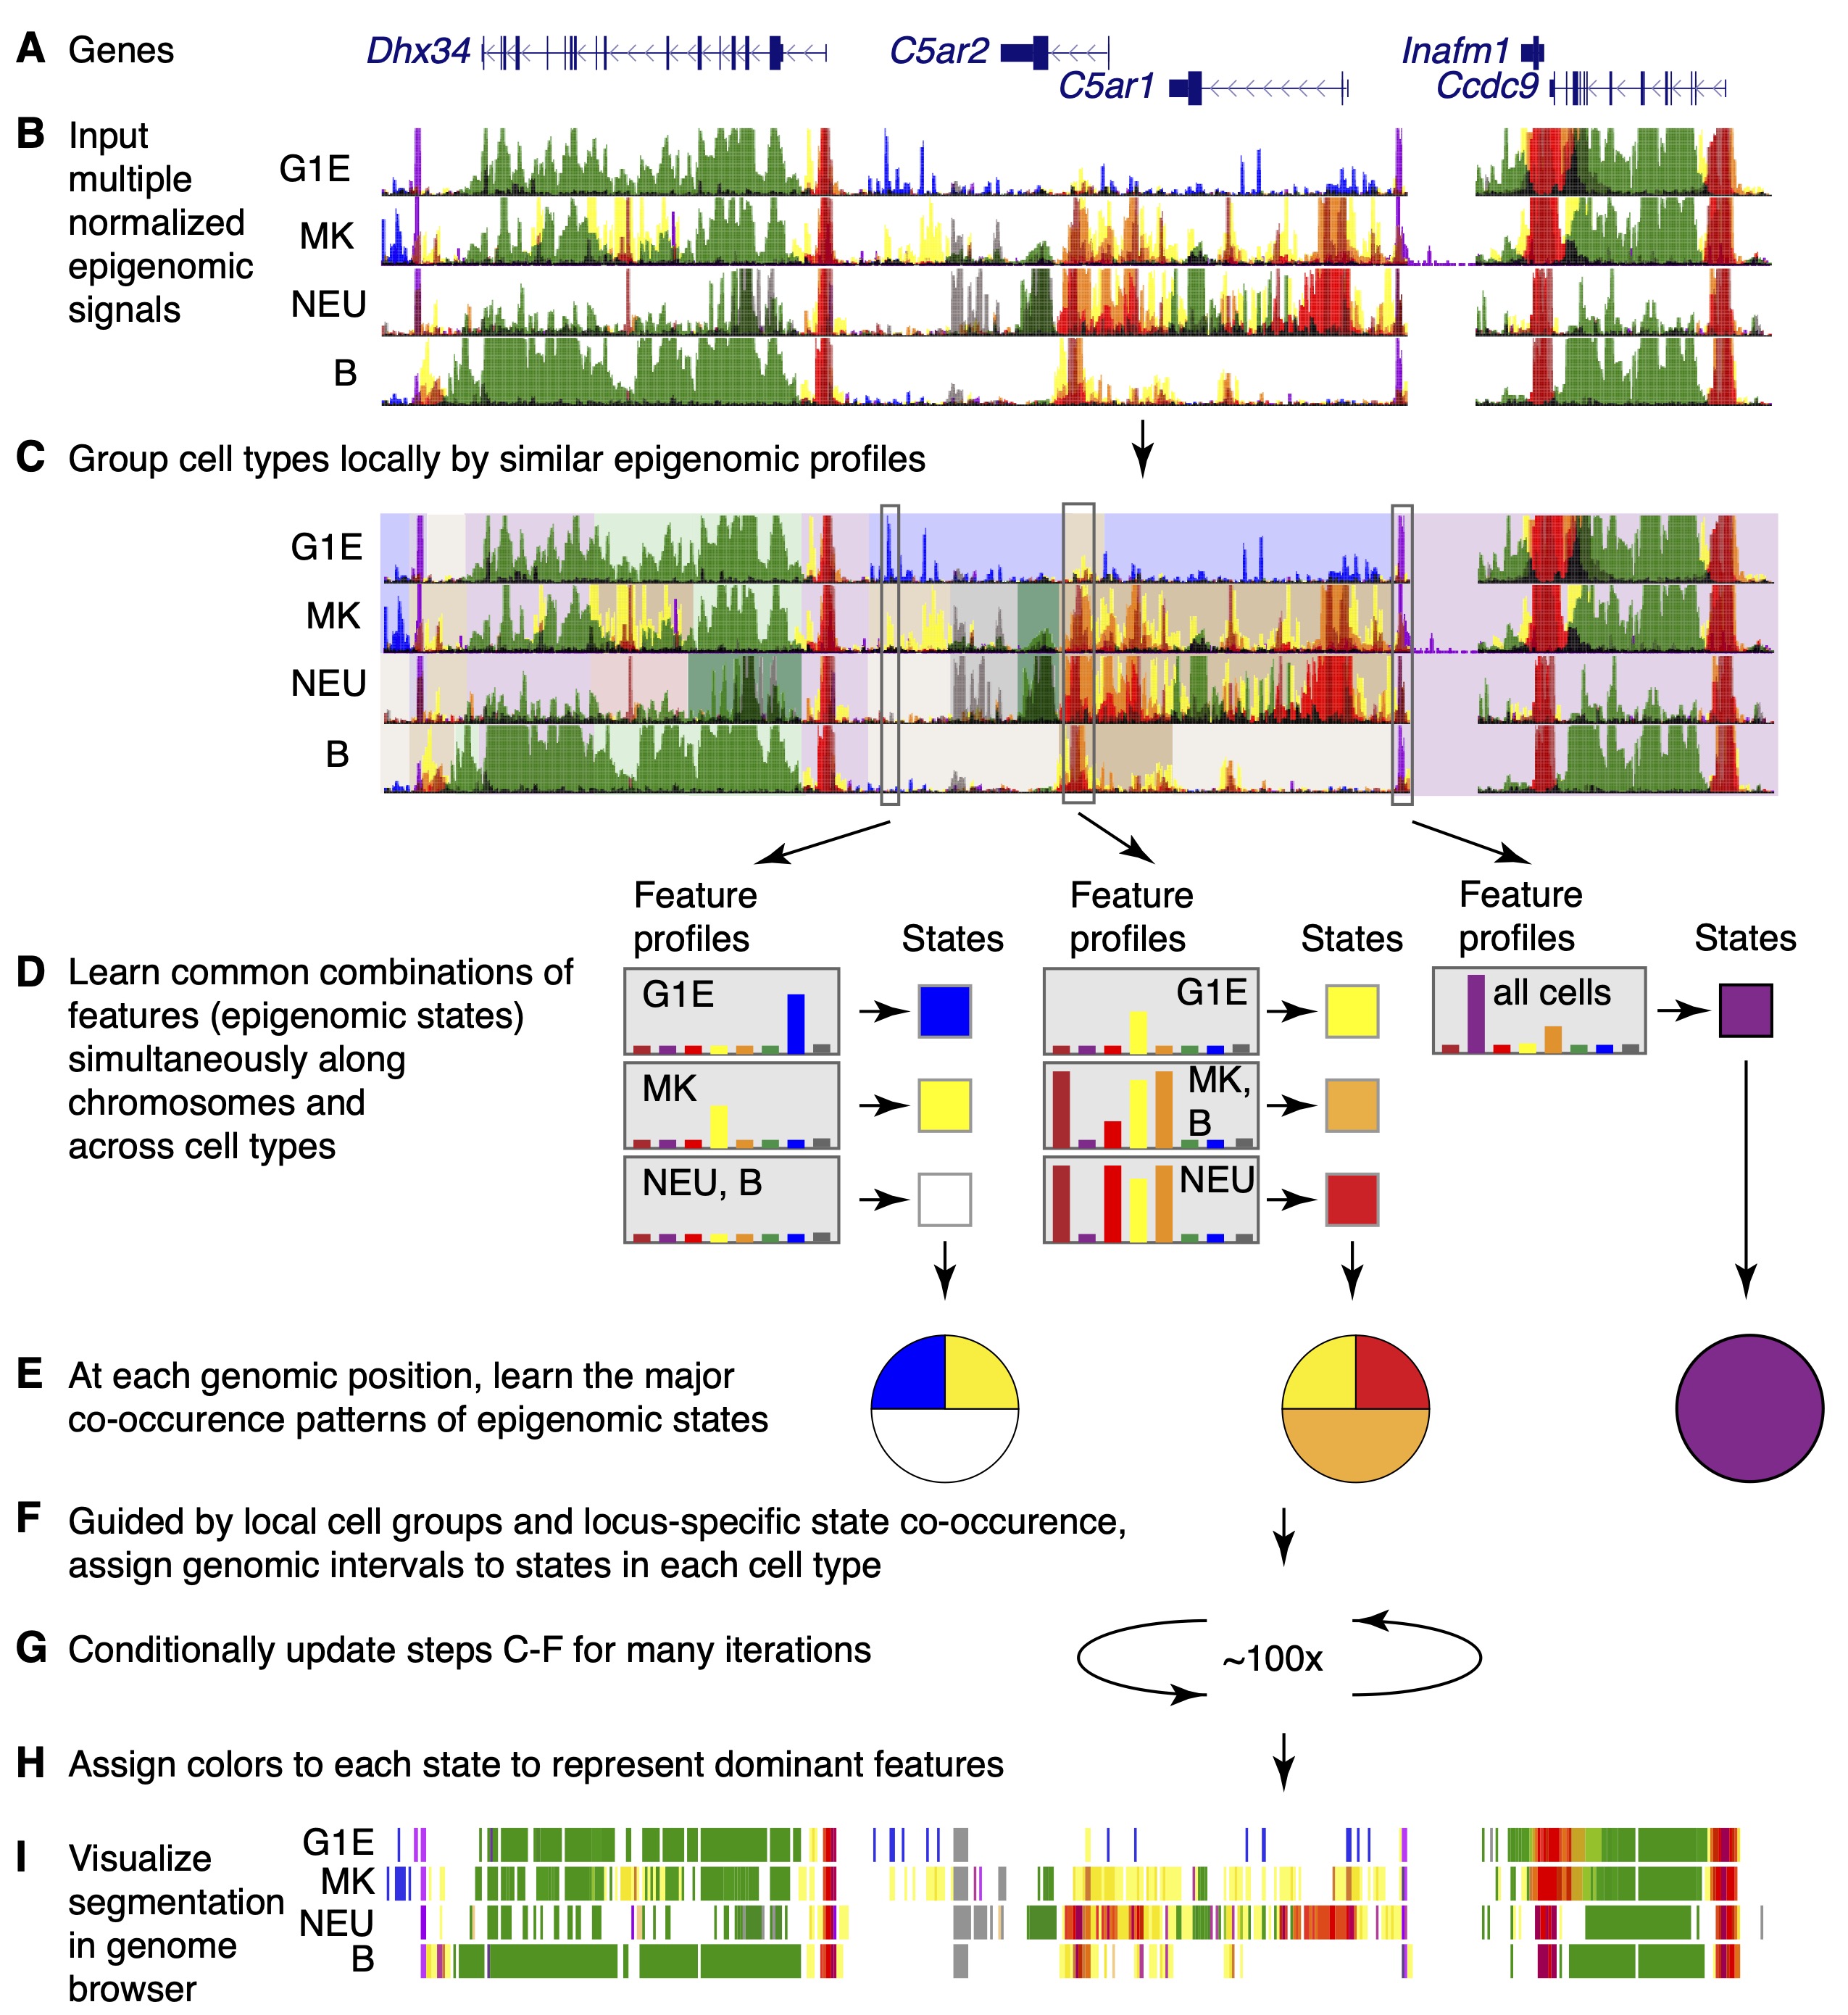
Epigenetic states from IDEAS segmentation and annotation The Integrative and Discriminative Epigenome Annotation System (IDEAS; Zhang et al. 2016, Zhang and Hardison 2017) learns a model for the most commonly occurring combinations of epigenetic features (e.g., histone modifications, chromatin accessibility, CTCF occupancy) simultaneously in two dimensions — along chromosomes and across cell types. These common combinations of epigenetic features constitute discrete chromatin states. IDEAS then annotates the epigenome of the cell types by assigning each genomic interval (usually 200bp) to one of the chromatin states based on the similarity to the input epigenetic signals for that cell type. The input epigenetic data are analyzed as continuous variables (they are not binarized) so that the chromatin states can differ in signal intensity as well as composition. The system leverages epigenetic information from locally related cell types when assigning states in cell types with missing data (Zhang and Mahony 2019). Its Bayesian statistical framework allows the incorporation of epigenetic models from different studies and even different species; this latter feature was essential to learning a chromatin state model jointly in both human and mouse (Xiang et al. 2024). This composite track shows the epigenetic state annotations resulting from the joint modeling in human and mouse blood cells. The states were learned in an iterative process that included input of states learned in one species into the modeling of states in the other species, leading to a 25 state model with the same states in each species (Xiang et al. 2024). The epigenetic features that compose each of the 25 states are summarized in Figure 1. The shade of blue in each cell illustrates the contribution of each of the input signals to the state, which is basically the emission frequency computed for that state. The normalized epigenetic signals used as input were chromatin accessibility from ATAC-seq, CTCF occupancy, and levels of the histone modifications H3K27ac, H3K27me3, H3K36me3, H3K4me1, H3K4me3, and H3K9me3 in multiple blood cell types. Each chromatin state was assigned a distinctive color, with warm colors (yellow and red hues) used for states associated with gene activation and cool colors (blues and grays) for states associated with gene repression, and shades of green for states associated with elongating transcription.
The subtracks in this composite track show epigenetic state annotations across the genomes in each of the several blood cell types. The display of the output from IDEAS is a compact image of the chromatin landscape of genomic intervals across cell types. The chromatin state assignments provide a consistent, well-resolved, and informative annotation for each genomic interval.
In "dense" mode, the display gives a compact view of the epigenetic landscape in each cell type. In "pack" or "full" mode, the genomic intervals are annotated with the number of the chromatin state (see right side of the Figure) in each cell type, which can distinguish between states with similar colors.
The track names (short name and the end of the long name) give an abbreviation for the blood cell type and replicate number (r1 or r2).
Mouse primary blood cells purified predominantly using cell surface markers include: LSK = Lin-Sca1+Kit+ cells from mouse bone marrow containing hematopoietic stem and progenitor cells, CMP = common myeloid progenitor cell, MEP = megakaryocyte-erythrocyte progenitor cell, ERY = erythroblast, GMP = granulocyte monocyte progenitor cell, MON = monocyte, NEU = neutrophil, CLP = common lymphoid progenitor cell, B = B cell, NK = natural killer cell, T_CD4 = CD4+ T cell, T_CD8 = CD8+ T cell, CFUE = colony forming unit erythroid, fl = designates ERY derived from fetal liver, ad = designates ERY derived from adult bone marrow, CFUMK = colony forming unit megakaryocyte, iMK = immature megakaryocyte, MK_fl = megakaryocyte derived from fetal liver. AVE is a track with state assignments based on the average signal for each epigenetic feature across cell types.
Data from several immortalized cell lines were included. The G1E cells are an immortalized, GATA1-null cell line derived from mouse embryonic stem cells by gene targeting; these cells proliferate in culture as immature erythroid progenitor cells (Weiss, Yu, Orkin 1997). A stable subline of these cells, called G1E-ER4, undergoes terminal erythroid maturation when GATA1 function is restored as an activatable fusion of GATA1 to the ligand-binding domain of the estrogen receptor (ER). Untreated G1E-ER4 cells, carrying the inactive GATA1-ER, proliferate without differentiation, but treatment with estradiol (E2) activates the hybrid protein, effectively complementing the GATA1 loss-of-function and allowing synchronous erythroid differentiation and maturation (Gregory et al. 1999). An additional cell line model used here are murine erythroleukemia (MEL) cells, which can be chemically induced to mature into erythroblast-like cells with increased hemoglobin (iMEL). HPC7 cells are an immortalized line that serves as a model for mouse hematopoietic progenitor cells (Pinto do O 2002). These cells are capable of differentiation in vitro into more mature myeloid cells. CH12 cells are an immortalized line that is a model for mouse B cells; the epigenetic data on CH12 cells were used to generate the B cell epigenetic state annotation.
All data sources are provided in Xiang et al. 2024. The genome-wide signals for the epigenetic features were normalized across cell types using the S3V2 version of S3norm in the pipeline S3V2-IDEAS (Xiang et al. 2020 and 2021). These normalized data were used as input into IDEAS. The joint modeling across species is described in Xiang et al. 2024.
The major steps in IDEAS modeling are illustrated in Figure 2.
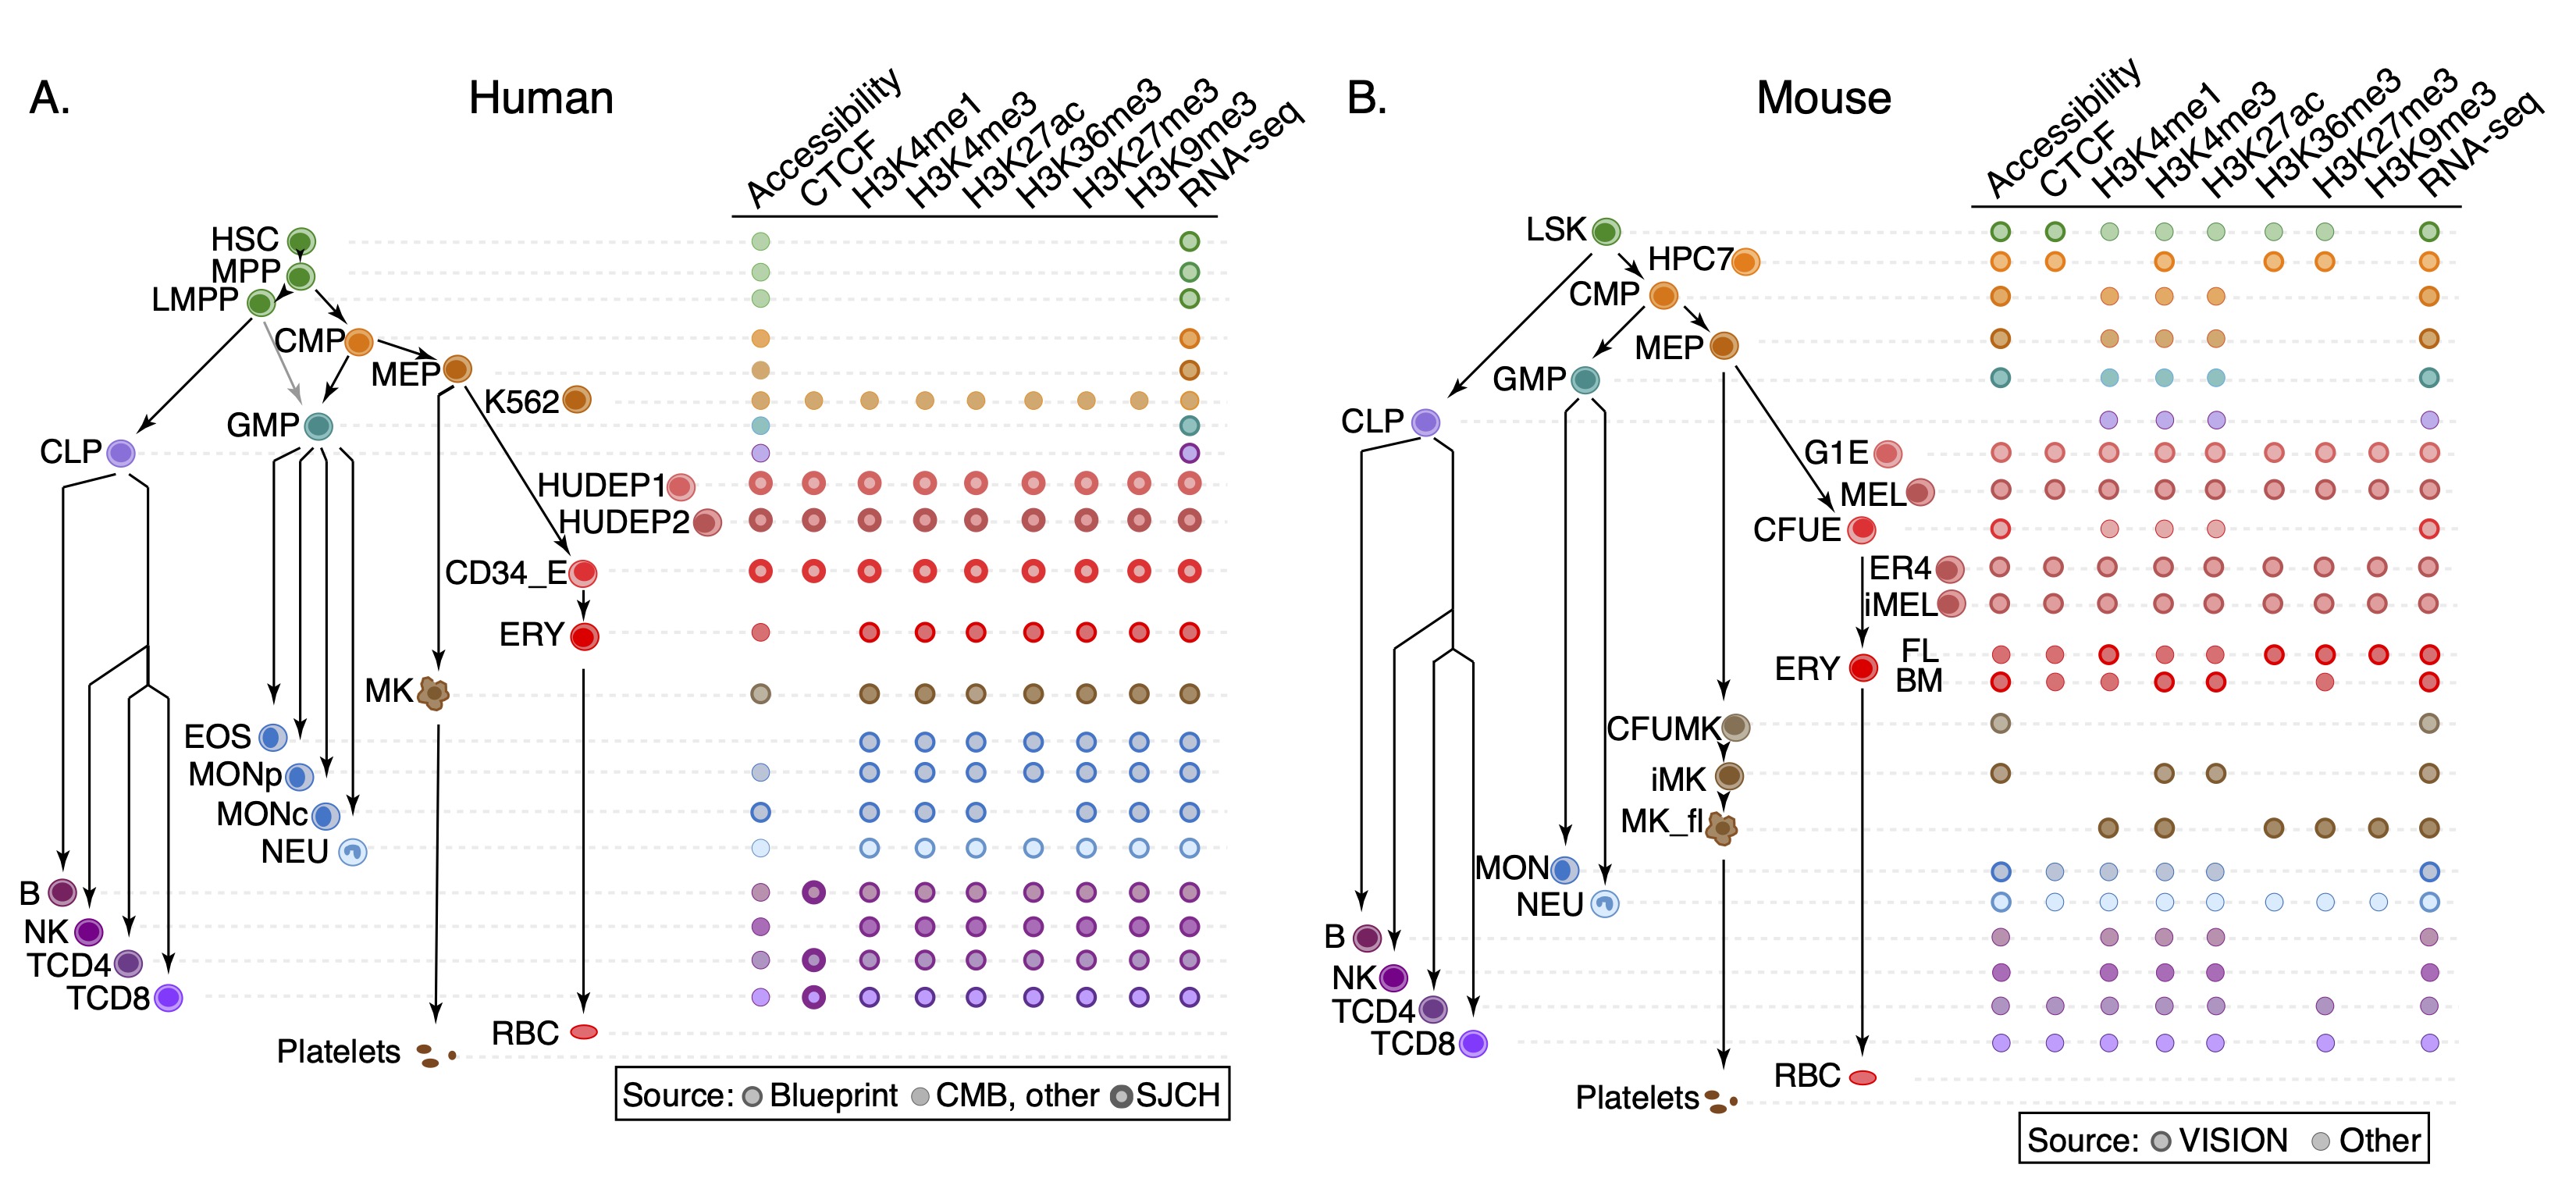
The IDEAS states and annotation in this composite track were generated from the input genome-wide signals for eight epigenetic features (chromatin accessibility from ATAC-seq, CTCF occupancy, and levels of the histone modifications H3K27ac, H3K27me3, H3K36me3, H3K4me1, H3K4me3, and H3K9me3) in multiple blood cell types, including both multi-lineage progenitor cells and differentiated cells, from both human and mouse (Figure 3). The normalized signals for these epigenetic features in each cell type can be viewed in the super track "Epigenetic signals."
The data normalization and IDEAS segmentation across species were done by Guanjue Xiang. The data downloads, re-mapping and processing, generation of the tracks displayed, and development of the track hub were done by Belinda Giardine.
Corces MR, Buenrostro JD, Wu B, Greenside PG, Chan SM, Koenig JL, Snyder MP, Pritchard JK, Kundaje A, Greenleaf WJ, Majeti R, Chang HY. Lineage-specific and single-cell chromatin accessibility charts human hematopoiesis and leukemia evolution. Nat Genet. 2016 Oct;48(10):1193-203. doi: 10.1038/ng.3646. Epub 2016 Aug 15. PMID: 27526324; PMCID: PMC5042844.
Gregory T, Yu C, Ma A, Orkin SH, Blobel GA, Weiss MJ. GATA-1 and erythropoietin cooperate to promote erythroid cell survival by regulating bcl-xL expression. Blood. 1999; 94:87-96. PMID: 10381501.
Heuston EF, Keller CA, Lichtenberg J, Giardine B, Anderson SM; NIH Intramural Sequencing Center; Hardison RC, Bodine DM. Establishment of regulatory elements during erythro-megakaryopoiesis identifies hematopoietic lineage-commitment points. Epigenetics Chromatin. 2018 May 28;11(1):22. PMID: 29807547; PMCID: PMC5971425.
Martens JH, Stunnenberg HG. BLUEPRINT: mapping human blood cell epigenomes. Haematologica. 2013 Oct;98(10):1487-9. doi: 10.3324/haematol.2013.094243. PMID: 24091925; PMCID: PMC3789449.
Pinto do O P, Richter K, Carlsson L. Hematopoietic progenitor/stem cells immortalized by Lhx2 generate functional hematopoietic cells in vivo. Blood. 2002 Jun 1;99(11):3939-46. doi: 10.1182/blood.v99.11.3939. PMID: 12010792.
Qi Q, Cheng L, Tang X, He Y, Li Y, Yee T, Shrestha D, Feng R, Xu P, Zhou X, Pruett-Miller S, Hardison RC, Weiss MJ, Cheng Y. Dynamic CTCF binding directly mediates interactions among cis-regulatory elements essential for hematopoiesis. Blood. 2021 Mar 11;137(10):1327-1339. doi: 10.1182/blood.2020005780. PMID: 33512425; PMCID: PMC7955410.
Stunnenberg HG; International Human Epigenome Consortium; Hirst M. The International Human Epigenome Consortium: A Blueprint for Scientific Collaboration and Discovery. Cell. 2016 Dec 15;167(7):1897. doi: 10.1016/j.cell.2016.12.002. Erratum for: Cell. 2016 Nov 17;167(5):1145-1149. doi: 10.1016/j.cell.2016.11.007. PMID: 27984737.
Weiss MJ, Yu C, Orkin SH. Erythroid-cell-specific properties of transcription factor GATA-1 revealed by phenotypic rescue of a gene-targeted cell line. Mol Cell Biol. 1997; 17:1642-1651. PMID: 9032291; PMCID: PMC231889.
Xiang G, Keller CA, Heuston E, Giardine BM, An L, Wixom AQ, Miller A, Cockburn A, Sauria MEG, Weaver K, Lichtenberg J, Göttgens B, Li Q, Bodine D, Mahony S, Taylor J, Blobel GA, Weiss MJ, Cheng Y, Yue F, Hughes J, Higgs DR, Zhang Y, Hardison RC. An integrative view of the regulatory and transcriptional landscapes in mouse hematopoiesis. Genome Res. 2020 Mar;30(3):472-484. PMID: 32132109; PMCID: PMC7111515.
Xiang G, Keller CA, Giardine B, An L, Li Q, Zhang Y, Hardison RC. S3norm: simultaneous normalization of sequencing depth and signal-to-noise ratio in epigenomic data. Nucleic Acids Res. 2020 May 7;48(8):e43. doi:10.1093/nar/gkaa105. PMID: 32086521; PMCID: PMC7192629.
Xiang G, Giardine BM, Mahony S, Zhang Y, Hardison RC. S3V2-IDEAS: a package for normalizing, denoising and integrating epigenomic datasets across different cell types. Bioinformatics. 2021 Sep 29;37(18):3011-3013. doi:10.1093/bioinformatics/btab148. PMID: 33681991; PMCID: PMC8479670.
Xiang G, He X, Giardine BM, Isaac KJ, Taylor DJ, McCoy RC, Jansen C, Keller CA, Wixom AQ, Cockburn A, Miller A, Qi Q, He Y, Li Y, Lichtenberg J, Heuston EF, Anderson SM, Luan J, Vermunt MW, Yue F, Sauria MEG, Schatz MC, Taylor J, Göttgens B, Hughes JR, Higgs DR, Weiss MJ, Cheng Y, Blobel GA, Bodine DM, Zhang Y, Li Q, Mahony S, Hardison RC. Interspecies regulatory landscapes and elements revealed by novel joint systematic integration of human and mouse blood cell epigenomes. Genome Res. 2024 Aug 20;34(7):1089-1105. PMID: 38951027; PMCID: PMC11368181.
Zhang Y, An L, Yue F, Hardison RC. Jointly characterizing epigenetic dynamics across multiple human cell types. Nucleic Acids Res. 2016 Aug 19;44(14):6721-31. doi: 10.1093/nar/gkw278. Epub 2016 Apr 19. PMID: 27095202; PMCID: PMC5772166.
Zhang Y, Hardison RC. Accurate and reproducible functional maps in 127 human cell types via 2D genome segmentation. Nucleic Acids Res. 2017 Sep 29;45(17):9823-9836. doi: 10.1093/nar/gkx659. PMID: 28973456; PMCID: PMC5622376.
Zhang Y, Mahony S. Direct prediction of regulatory elements from partial data without imputation. PLoS Comput Biol. 2019 Nov 4;15(11):e1007399. doi: 10.1371/journal.pcbi.1007399. PMID: 31682602; PMCID: PMC6855516.
These data are available for use without restrictions.
Ross Hardison rch8@psu.edu